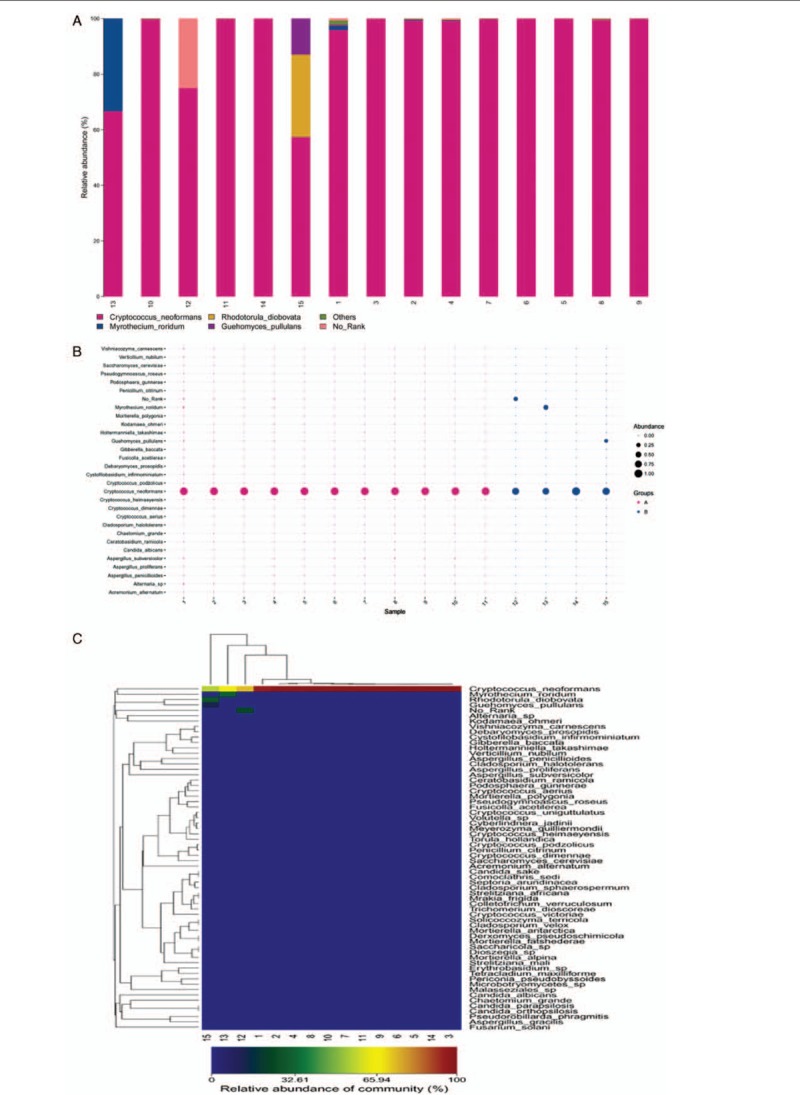
Figure 1.

Species distribution of fungal OTU in cerebrospinal fluid sample. All samples from 11 infected patients yielded detectable cryptococcal-specific ITS1 DNA with top abundance. (A) Column diagram of fungal OTU distribution in CSF. Abscissa values represent sample number, coordinate values represent species abundance, and the corresponding colors represent different species as shown in the figure. (B) Bubble map of fungal OTU distribution in CSF. Figure in the abscissa represents sample number, ordinate represents different species. Different colors illustrate different groups, and the size of the bubbles represents the species abundance. (C) Heat map of fungal OTU distribution in CSF. Each column represents a different sample, each row represents a different species, and the corresponding color represents the abundance of species. Colors from blue to red indicate species abundance from small to large. OTU: Operational taxonomic unit.
