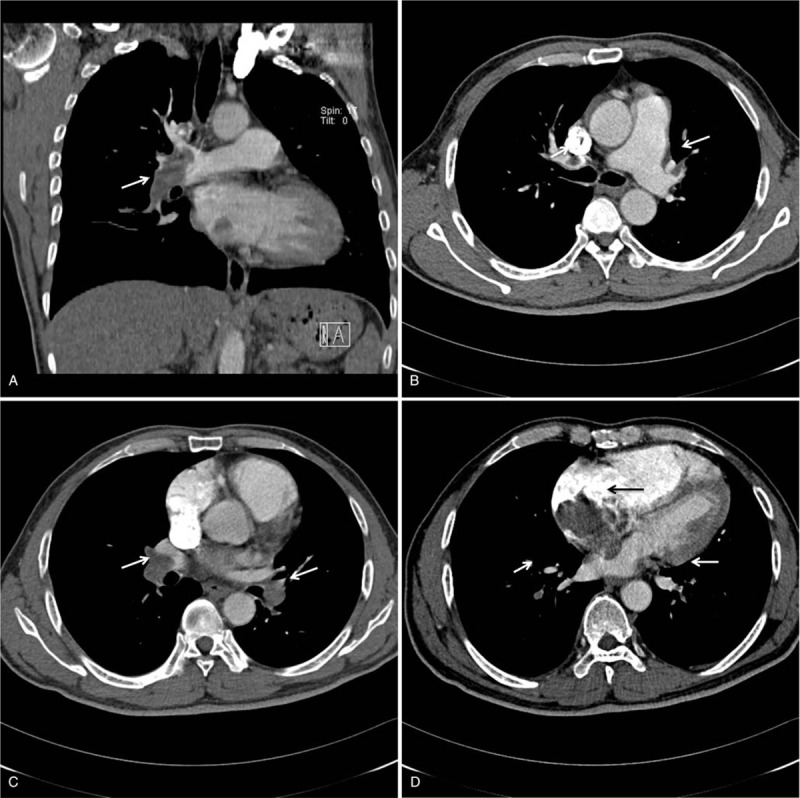
Figure 2.

A. The coronal image shows the filling defects in the right main and lower lobe PA (white arrow). B. Transverse images show filling defects in both upper lobe PAs (white arrow). C. Transverse images showed filling defects in both lower lobe PAs (white arrow). D. The transverse image showed an irregular mass in the right atrium (black arrow) and filling defects in both lower segmental PAs (white arrow). PA = pulmonary arteries.
