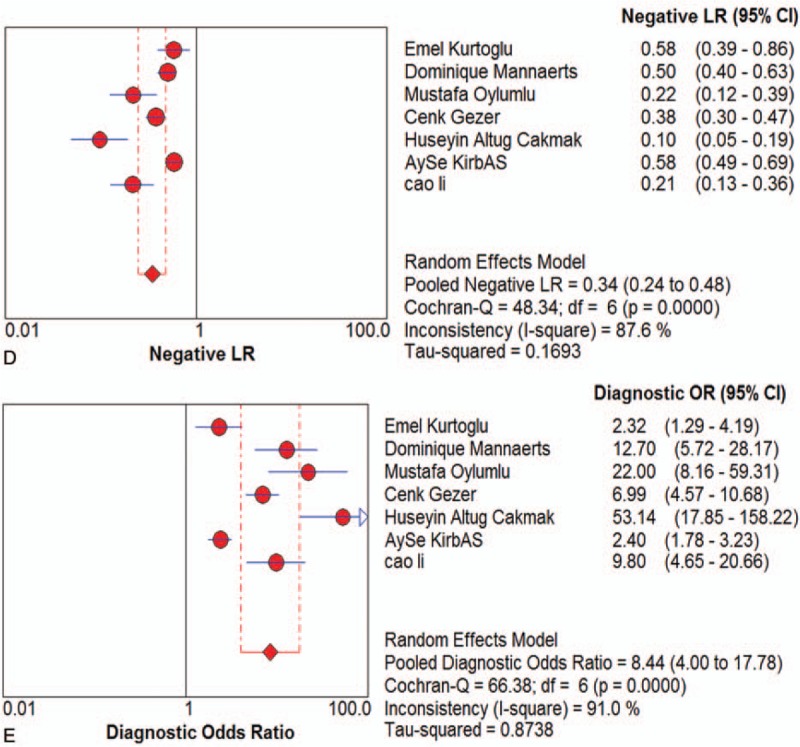
Figure 3 (Continued).

The indicator of effect. Forest plot of estimated sensitivity (A) specificity (B) positive likelihood ratio (C) negative likelihood ratio (D) diagnostic odds ratio (E) for quantitative analysis of Neutrophil-Lymphocyte Ratio in the diagnosis of preeclampsia.
