Figure 2.

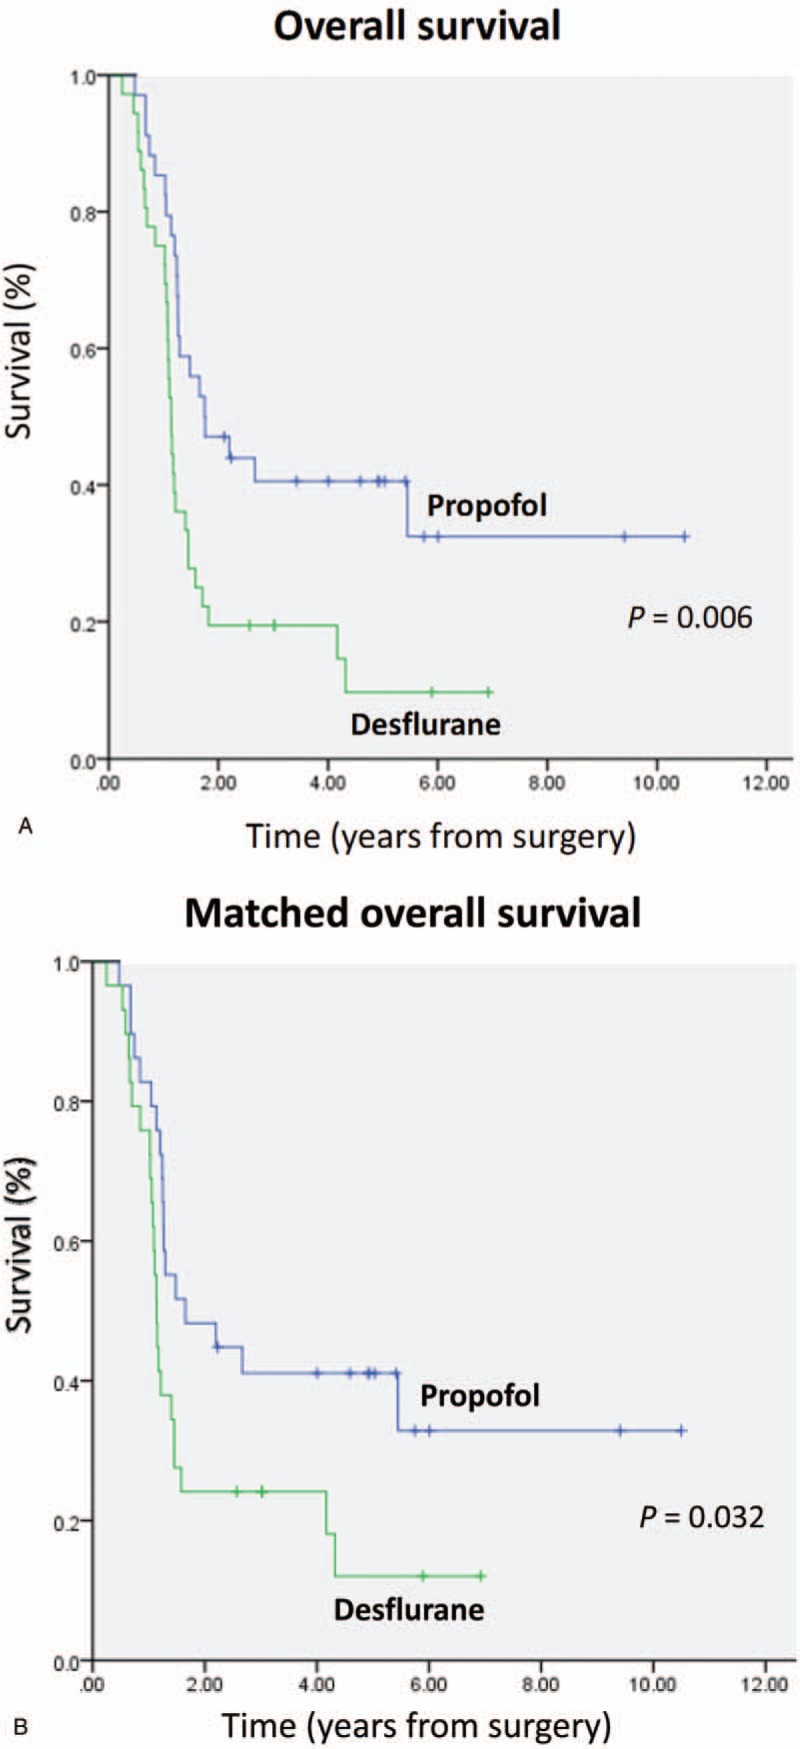
A, Overall survival curves from the date of surgery by anesthesia type. B, Overall survival curves from the date of surgery by anesthesia type after propensity score matching.

A, Overall survival curves from the date of surgery by anesthesia type. B, Overall survival curves from the date of surgery by anesthesia type after propensity score matching.