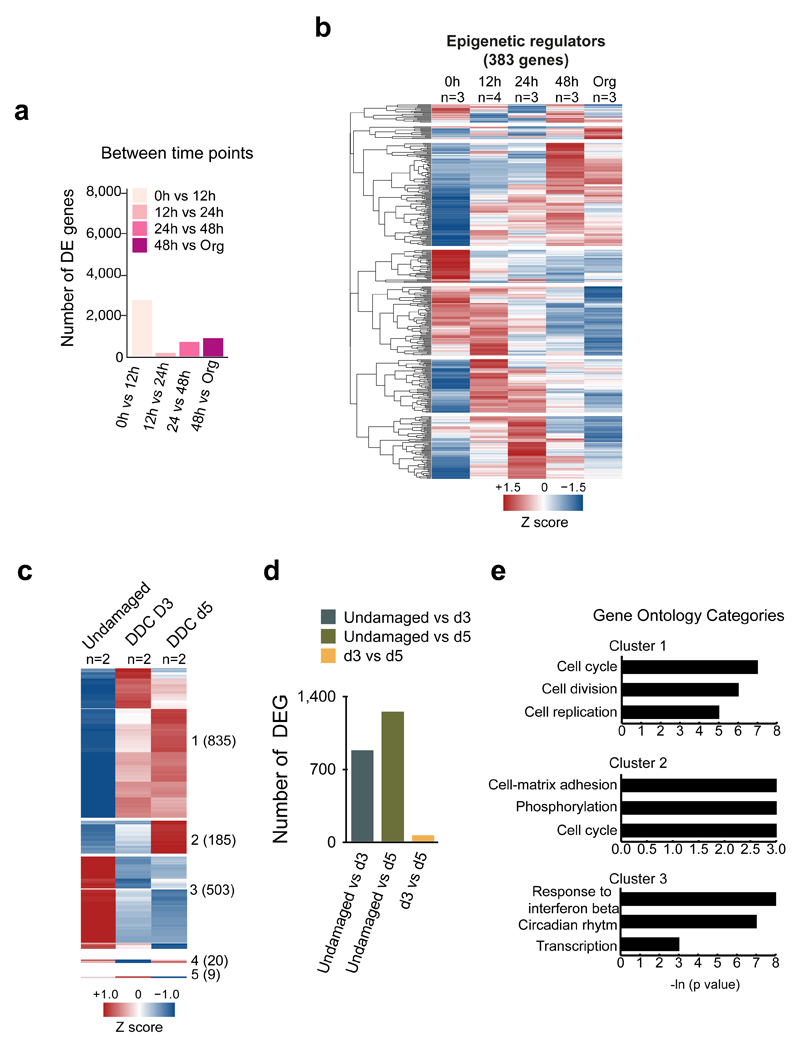
Extended Data Figure 2. Transcriptional changes in ductal cells in vitro during liver organoid formation and in vivo upon damage.
a-e, RNA-seq analysis of ductal cells isolated from adult livers (0h) and at different time points after culture. For DE genes, a pairwise approach with Wald test was performed on each gene using Sleuth. FDR <0.1 was selected as threshold. a, Graphs represent the number of significantly DE genes for each comparison. b, Hierarchical clustering analysis of epigenetic regulators found DE (383 out of 698 published in ref 49), in at least one comparison. Heatmap represents averaged TPM values scaled per gene. Results are presented as the averaged gene expression of ≥3 biological replicates. c-e, RNA-seq analysis of ductal cells isolated from adult livers (0h) and at day 3 and day 5 after liver damage (n=2 independent mice per time point). The heatmap shows 1552 genes DE at least in one comparison (TPM>5, FDR<0.1, |b|>0.58). Clustering analysis identified 5 different clusters (Clusters 1-5) according to the expression profile. Number of genes in each cluster is indicated in brackets. Results are presented as average of the at least 3 biological replicates. d, Graph represents the number of significant DE genes in the different comparisons. e, GO and statistical analyses of the 3 main clusters identified in c were perfomed using DAVID 6.8.

