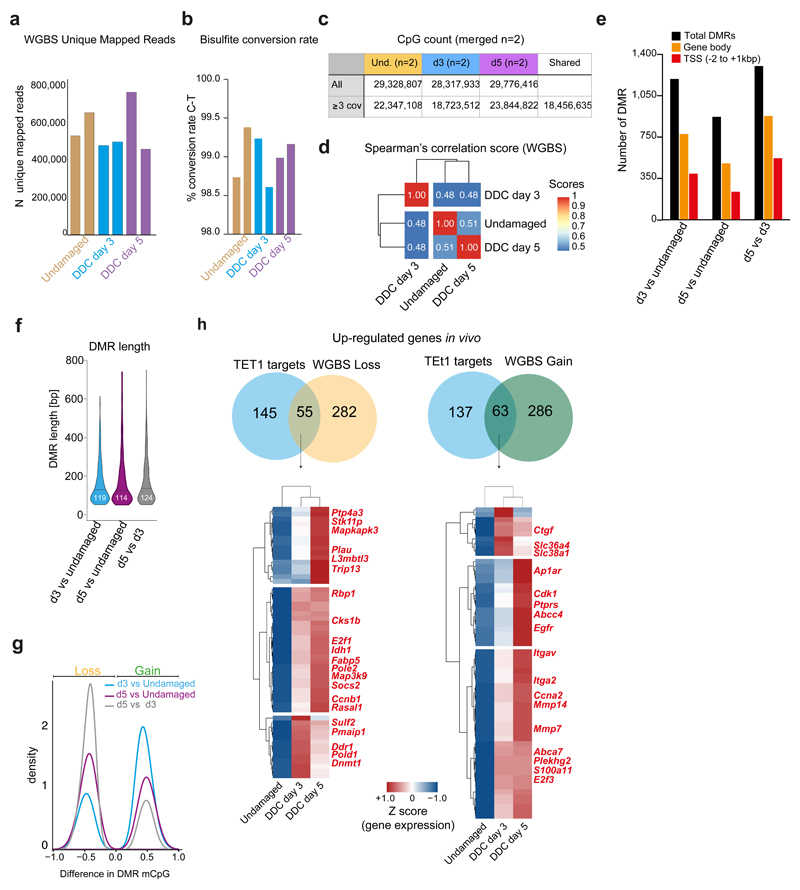
Extended Data Figure 4. WGBS of ductal cells upon damage uncovers a global epigenetic remodelling of the DNA methylome.
a, Number of WGBS unique mapped reads in the different biological replicates. b, Bisulfite conversion rate. c-h, WGBS analyses were performed in merged biological replicates per time point (n=2). Only CpG sites with ≥3 reads were further analysed. c, CpG counts in merged biological replicates per time point. d, Genome-wide Spearman’s correlation score at the time points analysed shows dynamic CpG modifications. e, Functional localisation of DMRs. DMRs were called if the difference in cytosine modification between samples was ≥25% with a p-value of <0.05, using DSS software. f, Violin plot of the DMR length distribution (in base pairs) identified in the n=2 biological replicates. Lines and numbers, median. g, Density plot indicating the difference in mCpG levels for loss/gain DMRs for each comparison. h, Venn diagram showing the overlap between TET1 targets (see Figure 5) that are transcriptionally up-regulated and genes showing either loss (left) or gain (right) of mCpG at the TSS according to the WGBS analyses. Hierarchical clustering analyses of the overlapping genes are presented as heatmaps of TPMs scaled per gene (Z-score).

