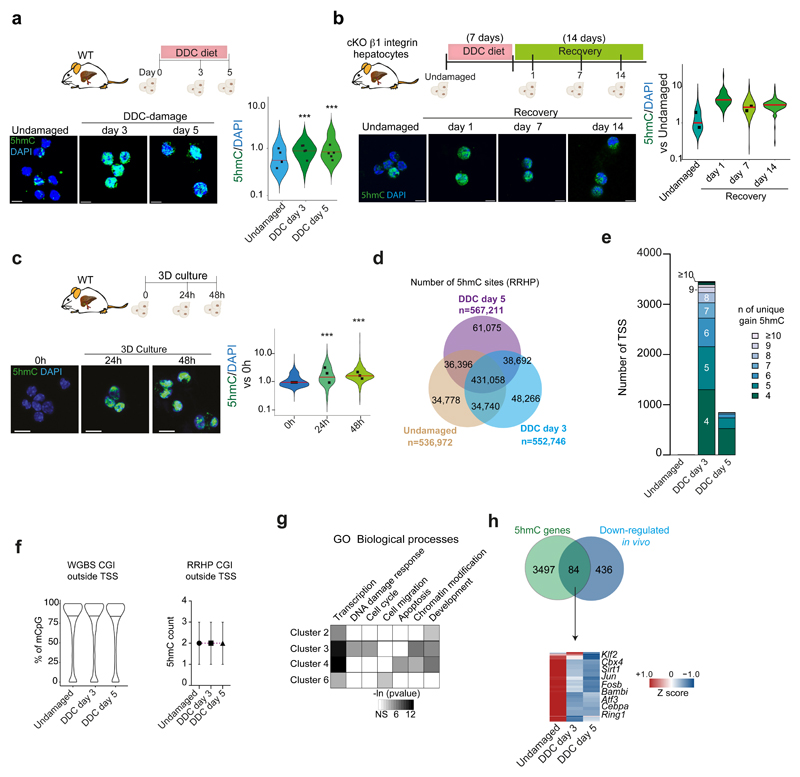
Extended Data Figure 5. 5hmC levels increase in ductal cells in vitro andin vivo upon damage.
a-c, EpCAM+ ductal cells sorted from 0.1% DDC livers (a), β1 integrin mutant mice fed with normal chow (undamaged) or DDC (b) or WT undamaged livers and grown as organoids (c). 5hmC fluorescence intensity was normalised to DAPI. Data are presented as violin plots of the ratio 5hmC/DAPI. Each dot represents the median value (shown in red) of cells counted/mouse (a, n=353 cells from 4 undamaged mice, n= 231 cells from 5 mice after 3 days of DDC, and n=392 cells from 5 mice at DDC d5; b, n=138 cells from undamaged, n=119 cells at day 1, n=247 at day 7 and n=125 at day 14 after returning the mice to normal chow (recovery); c, n=2500 (0h), n=900 (24h) and n=2000 (48h) cells from n=3 independent experiments. p-values were calculated using pairwise comparisons with Wilcoxon rank sum test. a, d3 vs d0 p= 1x10-13 ; d5 vs d0 p< 2.2x10⁻¹⁶. c, 0h vs 24h p< 2.2x10⁻¹⁶ ; 48h vs 0h p< 2.2x10⁻¹⁶. Scale bar, 10μm. d, All 5hmC sites identified by RRHP. e, Number of genes associated to TSS showing differential 5hmC levels. The number of CpG sites (n) with unique gain of hydroxymethylation is shown. f, Graphs represent distribution of percentage of mCpG identified by WGBS in CGI outside TSS (n=32673) using the average of the 2 independent samples (violin plots, black lines median, left) and number of 5hmC counts (median±IQR) in CGI outside TSS (n= 25579) (right) (n=2 independent samples). g, GO and statistical analyses of the clusters identified in Fig. 4j were performed using DAVID 6.8. Heatmap shows the expression profile of the 84 overlapping genes and is presented as averaged Z score of (n=2)

