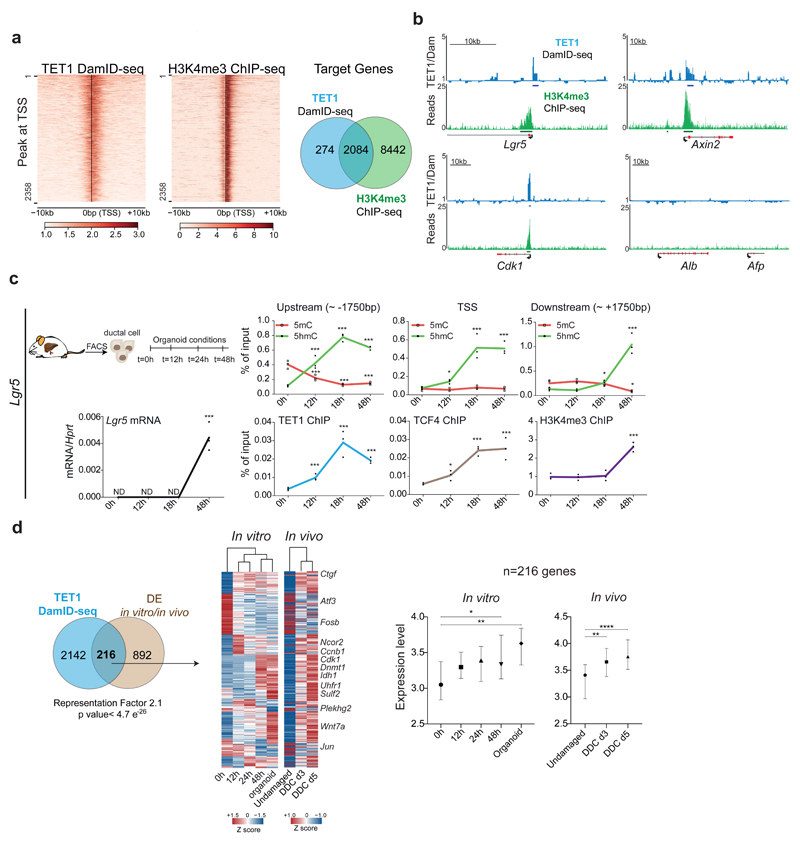
Fig. 5. TET1 regulates the activation of genes involved in organoid formation and liver regeneration.
a-b, TET1-DamID analyses were performed in n=3 independent experiments. a, Heatmaps of TET1-DamID (left) and H3K4me3 (right) binding at the TSS Venn diagram indicates the overlap between the DamID-seq TET1 and H3K4me3 target genes identified by ChIP-seq. b, Genome tracks of TET1 (Dam-ID) and H3K4me3 (ChIP) peaks on selected genes. Graphs show TET1-Dam/Dam only ratio (blue) and H3K4me3 number of reads (green). c, Sorted EpCAM+ cells from WT undamaged livers were cultured as organoids and analysed at the indicated time points (n=3 experiments). Upper panels: hMeDIP (dots, green) and MeDIP (squares, red) levels in the indicated genomic region upstream and downstream of the Lgr5 TSS. Lower panels: TET1 (blue), TCF4 (brown) and H3K4me3 (purple) ChIP-qPCR at the TSS. mRNA expression is shown in black. p-value was obtained using Student's two-tailed t-test. Statistical analyses were performed vs t=0h. (Upstream 5hmC 12h p=0.004305136, 18h, p=3.26345E-05, 48h p=8.36527E-06; 5mC 12h p=0.009532377, 18h, p=0.001130234, 48h p=0.001564496; TSS 5hmC 12h p=0.011044339, 18h, p=0.005230947, 48h p=0.000485153; Downstream 5hmC 18h, p=0.004305136, 48h p=3.26345E-05; 5mC 48h p=8.36527E-06; Lgr5 mRNA 48h p=0.001991489; TET1 ChIP 12h p=0.005403182, 18h, p=0.003789515, 48h p=0.000119801; H3K4me3 ChIP 48h p= 0.000774002). *, p<0.05; **, p <0.01***; p <0.001. d, Overlap between the 1108 DE genes identified in Fig. 2h-i and TET1 targets identified by DamID-seq. p-value of the overlap is calculated using normal approximation of the hypergeometric probability. The heatmap (TPM, z-scored) presents the expression profile of the 216 TET1 targets DE in vivo and in vitro. Graphs show the gene expression levels of 216 genes (median±95% CI) as ln(TPM +1). p-values are obtained with one-way ANOVA followed by Tukey’s multiple comparisons test. 0h vs 48h p=0.0379, 0h vs Org p=0.0039; Und vs d3 p=0.0013, Und vs d5 p<0.0001.*, p< 0.05; **, p <0.01; ***, p <0.001.

