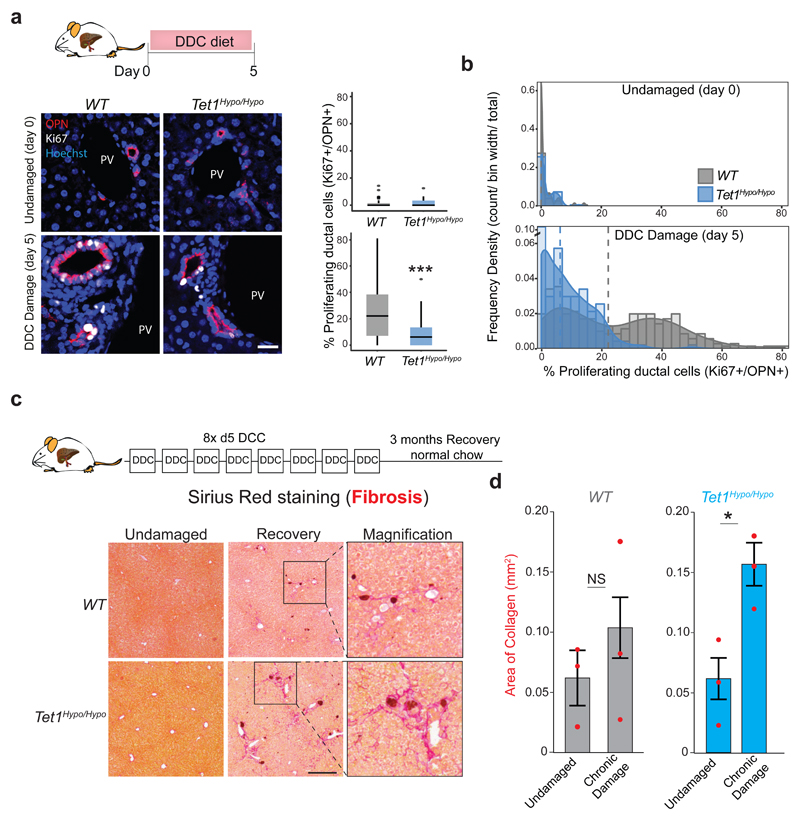
Fig. 7. Tet1 hypomorphic mice exhibit reduced ductal regeneration and extensive fibrosis upon damage.
a-b, WT (grey) and Tet1hypo/hypo mice (blue) were fed normal chow or a chow supplemented with 0.1% DDC for 5 days. Individual values of independent experiments are shown in Extended Data Figure 8f. a, Representative images of immunofluorescence staining for the ductal marker OPN (red) and the proliferation marker Ki67 (white). Scale bar, 25μm. PV, portal vein. Graphs represent the percentage of proliferating (Ki67+) ductal cells (OPN+) (median±IQR) obtained from 55 FOV for WT (n=3) and 56 FOV for Tet1hypo/hypo mice (n=3) at day 0 (undamaged), and 253 FOV for WT (n=7) and 169 FOV for Tet1hypo/hypo (n=6) at day5 of DDC damage. Data are represented a boxplots showing the median, IQR and overall range. Dots represent outliers from a single counted FOV defined as >1.5 IQR above or below the median. p-values were obtained using two-sided KolmogoroV-Smirnov test. ***, p< 2.2x10⁻¹⁶. b, Histogram showing the population distribution of proliferating ductal cells (OPN+, Ki67+) by plotting frequency density of counts across the sample range (bar) and the kernel density estimate line. Dashed lines show median values. c-d, WT (grey) and Tet1hypo/hypo (blue) mice were fed normal chow or a chow supplemented with 0.1% DDC for 5 days for 8 consecutive cycles as described in the scheme and methods. Liver tissues were collected 3 months after the last cycle and PicroSirius red staining was performed to analyse the levels of fibrosis (collagen deposition). c, Representative images of PicroSirius red staining (red) (n=3 mice per time point). Scale bar, 200μm. d, Graph represents mean±95% CI of the area of collagen deposition per FOV (n=3 mice per time point per genotype). Statistical analysis was performed on the 3 mean values per genotype compared to undamaged using Student's two-tailed t-test. *, p<0.05.

