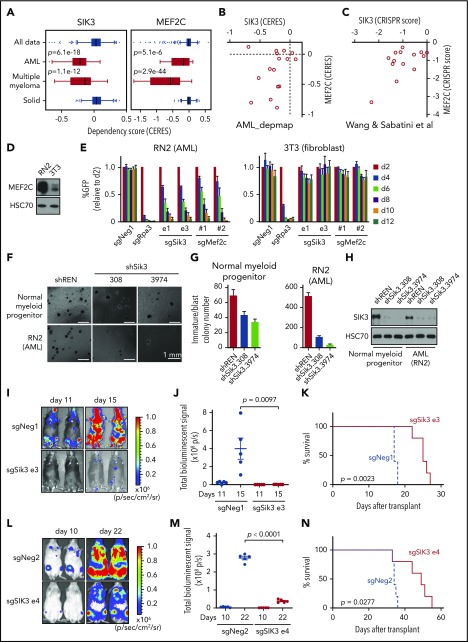
Figure 1.
SIK3 and MEF2C are selectively essential for the growth of AML and multiple myeloma cells. (A) SIK3 and MEF2C essentiality scores extracted from the DepMap database of cancer cell lines.35 Shown is a boxplot distribution of the copy number–adjusted essentiality score (CERES; a normalized metric of gene essentiality) of SIK3 and MEF2C across all 558 cell lines, 16 AML lines, 18 multiple myeloma lines, and 498 solid tumor cell lines. (B-C) Scatterplots of SIK3 and MEF2C essentiality scores in human AML cell lines in the DepMap (CERES) or from Wang et al52 (CRISPR scores). (D) Western blot analysis of MEF2C in RN2 and 3T3 whole-cell lysates. (E) Competition-based proliferation assays in which cells were infected with the indicated sgRNAs linked to GFP. Bar graphs represent the mean ± standard error of the mean (SEM; n = 3). (F) Bright-field images of methylcellulose-based colony-formation assays of normal myeloid progenitors or RN2 cells on day 7 after retroviral transduction with control or Sik3 shRNAs. (G) Quantification of the immature/blast colonies shown in panel F. Mean ± SEM (n = 4). (H) Western blot analysis of SIK3 performed on day 6 after infection of the indicated shRNAs. (I) Bioluminescence imaging of wild-type C57BL/6 mice receiving transplants of Cas9-expressing RN2 cells transduced with the indicated sgRNA. Representative images are shown on the indicated day after transplantation. (J) Quantification of bioluminescence from panel I. Values represent photons per second (p/s) of bioluminescent signal detection (mean ± SEM). The P value was calculated by unpaired Student t test (n = 5). (K) Survival curves of the mice in panel I. The P value was calculated by log-rank (Mantel-Cox) test (n = 5). (L) Bioluminescence imaging of NSG (NOD-SCID/IL2Rgammanull) mice which received transplants of Cas9-expressing MV4-11 cells transduced with the indicated sgRNA. Representative images are shown on the indicated day after transplantation. (M) Quantification of bioluminescence from panel L. Values represent photons per second (p/s) of bioluminescent signal detection (mean ± SEM). The P value was calculated by unpaired Student t test (n = 5). (N) Survival curves of the mice in panel L. The P value was calculated by log-rank (Mantel-Cox) test (n = 5). sgNeg1, sgNeg2, shREN: negative controls. sgRpa3: positive control.

