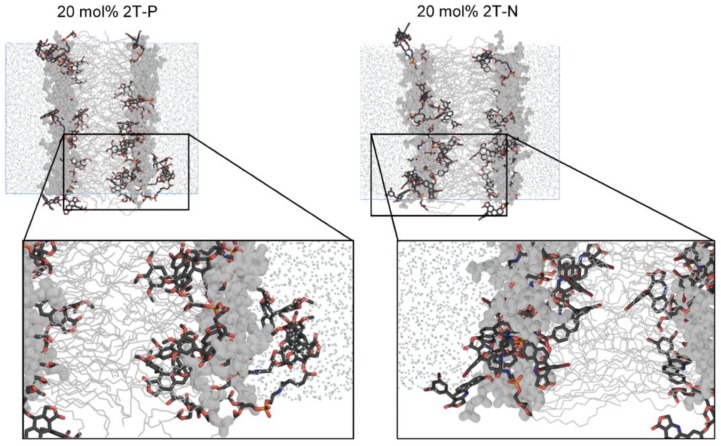
Figure 7.
Simulation images of systems incorporating 20 mol% 2T-P or 2T-N. DPPC lipids shown in gray, with tails depicted as thin lines and headgroups as thick lines. Explicit water molecules shown as reduced-size dots. All H atoms hidden for clarity. Drug and linker moieties colored by atom, as follows. black C, red O, orange P, and blue N.

