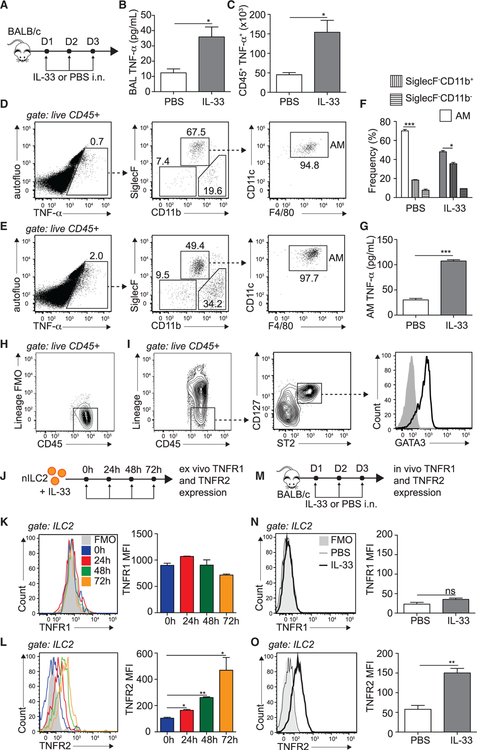
Figure 1. IL-33 Promotes TNF-α Secretion and TNFR2 Expression on ILC2s.
(A) BALB/cByJ mice were challenged i.n. on days 1–3 with 0.5 μg rmIL-33 or PBS.
(B) On day 4, BAL fluid was collected, and supernatant TNF-α was measured by ELISA.
(C) Number of TNF-α-producing CD45+ lung cells on day 4, cultured for 4 h with GolgiPlug.
(D–F) Representative flow cytometry plots in naive (D) and activated (E) lungs of CD45+ TNF-α+ cells backgated for AMs (CD45+ SiglecF+ CD11b−, CD11c+, and F4/80+) and SiglecF−CD11b+ and SiglecF−CD11b− populations and (F) corresponding quantitation presented as mean frequency ± SEM.
(G) AMs were FACS sorted from PBS- or rmIL-33-challenged mice on day 4 and cultured for 24 h in vitro (106 AMs/well), and supernatant TNF-α was measured by ELISA.
(H and I) Gating strategy for murine ILC2s showing (H) lineage− staining and (I) lineage−CD45+ CD127+ ST2+ GATA-3hi ILC2s.
(J) nILC2s were FACS sorted from naive BALB/cByJ mice and cultured (50 × 104/mL) ex vivo in the presence of rmIL-2 (10 ng/mL), rmIL-7 (10 ng/mL), and rmIL-33 (50 ng/mL) for the indicated times. nILC2s were gated as lineage− CD45+ ST2+ CD127+.
(K and L) Representative flow cytometry plot of TNFR1 (K) and TNFR2 (L) expression and corresponding quantitation, presented as Mean Fluorescence Intensity (MFI) ± SEM.
(M) BALB/cByJ mice were challenged i.n. on days 1–3 with 0.5 μg rmIL-33 or PBS.
(N and O) Representative flow cytometry plot of lung ILC2 expression of TNFR1 (N) and TNFR2 (O) expression on day 4 and corresponding quantitation, presented as MFI ± SEM.
Data are representative of 4 individual experiments (n = 5). *p < 0.05, **p < 0.01, ***p < 0.001; ns, non-significant. See also Figure S1.

