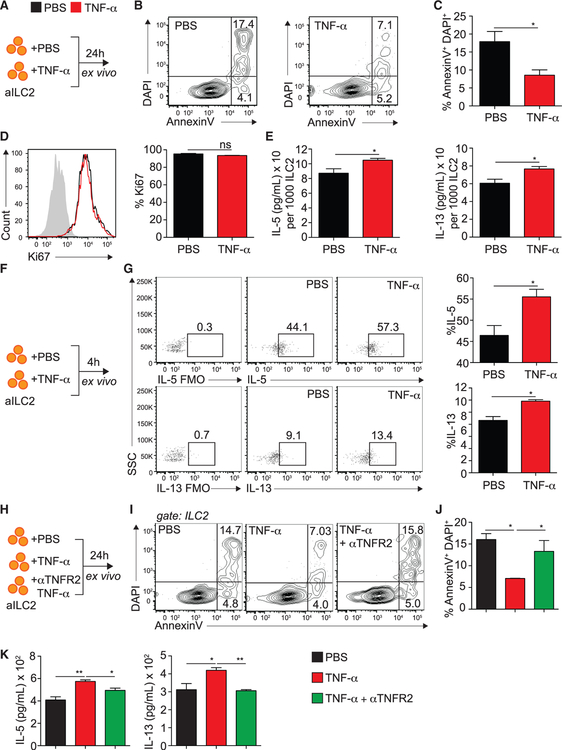
Figure 3. TNF-α Enhances ILC2 Survival and Activation via TNFR2.
(A) BALB/cByJ mice were challenged i.n. on days 1–3 with 0.5 μg rmIL-33. On day 4, aILC2s were FACS sorted as lineage− CD45+ ST2+ CD127+ and cultured ex vivo (50 × 104/mL) for 24 h with rmIL-2 (10 ng/mL) and rmIL-7 (10 ng/mL) with or without rmTNF-α (40 ng/mL).
(B) Representative flow cytometry plots of AnnexinV and DAPI expression on cultured ILC2s.
(C) Frequency of AnV+DAPI+ ILC2s ± SEM on cultured ILC2s.
(D) Representative flow cytometry plots of intranuclear Ki67-expressing ILC2s among cultured ILC2s and corresponding quantitation, presented as mean frequency ± SEM.
(E) Levels of IL-5 and IL-13 in cultured supernatants, measured by ELISA and normalized to the number of viable cells after culture.
(F) BALB/cByJ mice were challenged i.n. on days 1–3 with 0.5 μg rmIL-33. On day 4, aILC2s were FACS sorted as lineage− CD45+ ST2+ CD127+ and cultured ex vivo (50 × 104/mL) for 4 h with rmIL-2 (10 ng/mL) and rmIL-7 (10 ng/mL) with or without rmTNF-α (40 ng/mL) and GolgiPlug.
(G) Intracellular expression of IL-5 and IL-13 in cultured ILC2s and corresponding quantitation, presented as mean frequency ± SEM.
(H) BALB/cByJ mice were challenged i.n. on days 1–3 with 0.5 μg rmIL-33. On day 4, aILC2s were FACS sorted as lineage− CD45+ ST2+ CD127+ and cultured in vitro for 24 h with rmIL-2 (10 ng/mL) and rmIL-7 (10 ng/mL) with or without rmTNF-α (40 ng/mL) and αTNFR2 (10 μg/mL). αTNFR2 was added 30 min prior to rmTNF-α.
(I) Representative flow cytometry plots of AnnexinV/DAPI expression on cultured ILC2s.
(J) Frequency of AnV+DAPI+ ILC2s ± SEM on cultured ILC2s.
(K) Levels of IL-5 and IL-13 in culture supernatants, measured by ELISA.
Data are representative of 4 individual experiments (n = 5). *p < 0.05, **p < 0.01. See also Figure S3.

