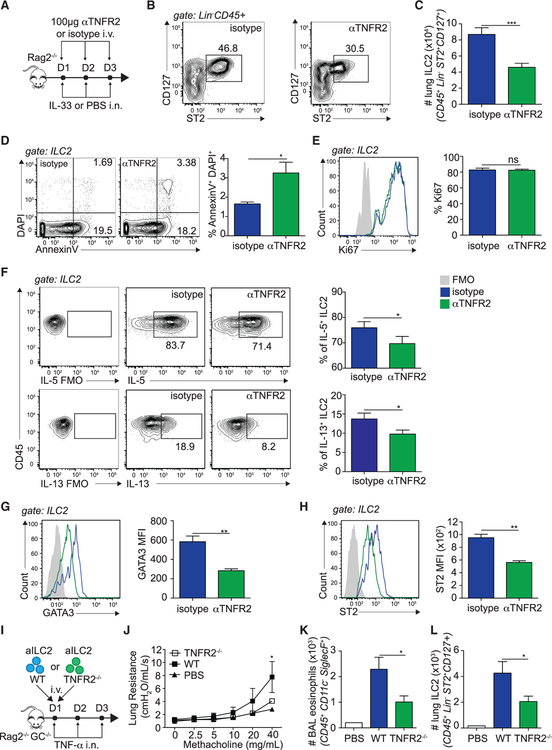
Figure 4. TNF-α, via TNFR2 Signaling, Enhances ILC2 Survival and Activation In Vivo.
(A) Rag2−/− mice received i.v. injections of 100 μg αTNFR2 or an isotype control and 0.5 μg rmIL-33 or PBS i.n. on days 1–3. On day 4, lung ILC2 numbers, proliferation, and apoptosis were measured.
(B) Representative flow cytometry plots of lung ILC2s in isotype control- or αTNFR2-treated mice. ILC2s were gated as lineage− CD45+ ST2+ CD127+.
(C) Total number of lung ILC2s, presented as mean numbers ± SEM.
(D and E) Representative flow cytometry plots of AnnexinV/DAPI (D) and intranuclear Ki67 expression (E) with corresponding quantitation, presented as frequency of Ki67+ ILC2s ± SEM (D) and AnV+DAPI+ ILC2s ± SEM (E).
(F) Representative flow cytometry plots of intracellular IL-5 and IL-13 expression by lung ILC2s cultured for 4 h with phorbol 12-myristate 13-acetate (PMA), ionomycin, and GolgiPlug and corresponding quantitation, presented as mean frequency ± SEM.
(G) Representative flow cytometry plots of intranuclear GATA-3 in lung ILC2s (CD45+Lin−ST2+CD127+) and corresponding quantitation, presented as MFI ± SEM.
(H) Representative flow cytometry plots of ST2 expression in GATA-3+ ILC2s and corresponding quantitation, presented as mean MFI ± SEM.
(I) C57BL/6 and TNFR2−/− mice were challenged i.n. on days 1–3 with 0.5 μg rmIL-33. On day 4, aILC2s were FACS sorted as lineage− CD45+ ST2+ CD127+ and cultured in vitro for 3 days with rmIL-2 (10 ng/mL), rmIL-7 (10 ng/mL), and rmIL-33 (50 μg/mL) prior to transfer of 50 × 103 aILC2s in 2 separate cohorts of Rag−/− Il2rg−/− mice, followed by i.n. administration of 50 ng rmTNF-α on days 1–3. On day 4, lung function, BAL, and lung ILC2s were analyzed.
(J) Lung resistance in response to increasing doses of methacholine.
(K) Total number of eosinophils in the BAL fluid, presented as mean numbers ± SEM.
(L) Total number of ILC2s in the lungs, presented as mean numbers ± SEM.
Data are representative of 3 individual experiments (n = 4–5). *p < 0.05, **p < 0.01. See also Figures S4–S6.

