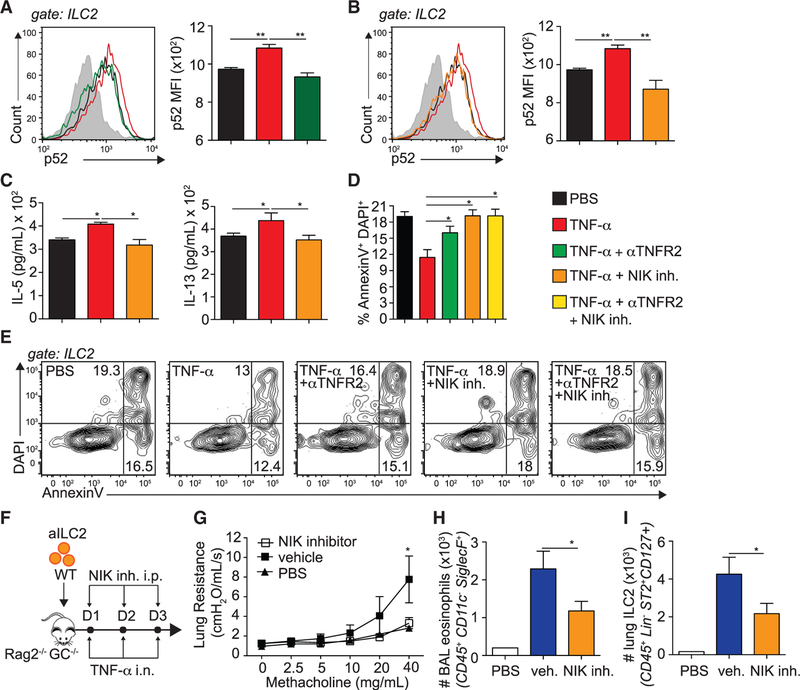
Figure 6. TNF-α Signaling via NIK Enhances ILC2-Dependent AHR.
(A–E) BALB/cByJ mice were challenged i.n. on days 1–3 with 0.5 μg rmIL-33. On day 4, aILC2s were FACS sorted as lineage− CD45+ ST2+ CD127+ and cultured ex vivo for 24 h with rmIL-2 (10 ng/mL) and rmIL-7 (10 ng/mL) with or without rmTNF-α (40 ng/mL), αTNFR2 (10 μg/mL), or NIK inhibitor (10 μM). αTNFR2 and the NIK inhibitor were added 30 min prior to rmTNF-α.
(A and B) NF-κB p52 representative flow cytometry plots in TNFR2 (A) and NIK (B) blocking experiments on ILC2s and corresponding quantitation, presented as MFI ± SEM.
(C) Levels of IL-5 and IL-13 secretion in culture supernatants, measured by ELISA.
(D) Frequency of AnnexinV+DAPI+ late apoptotic/necrotic ILC2s, presented as mean frequency ± SEM.
(E) Representative flow cytometry plots of AnnexinV+DAPI+ late apoptotic/necrotic ILC2s.
(F) C57BL/6 mice were challenged i.n. on days 1–3 with 0.5 μg rmIL-33. On day 4, aILC2s were FACS sorted as lineage−, CD45+ ST2+ CD127+ and cultured ex vivo for 3 days with rmIL-2 (10 ng/mL), rmIL-7 (10 ng/mL), and rmIL-33 (50 μg/mL) prior to transfer of 50 × 103 aILC2s in 2 separate cohorts of Rag−/− Il2rg−/− mice, followed by i.n. administration of 50 ng rmTNF-α and i.p. injection of 250 μg NIK inhibitor or vehicle on days 1–3. On day 4, lung function, BAL, and lung ILC2s were analyzed.
(G) Lung resistance in response to increasing doses of methacholine.
(H) Total number of eosinophils in the BAL fluid, presented as mean numbers ± SEM.
(I) Total number of ILC2s in the lungs, presented as mean numbers ± SEM.
Data are representative of 3 individual experiments (n = 5). *p < 0.05, **p < 0.01. See also Figure S3.

