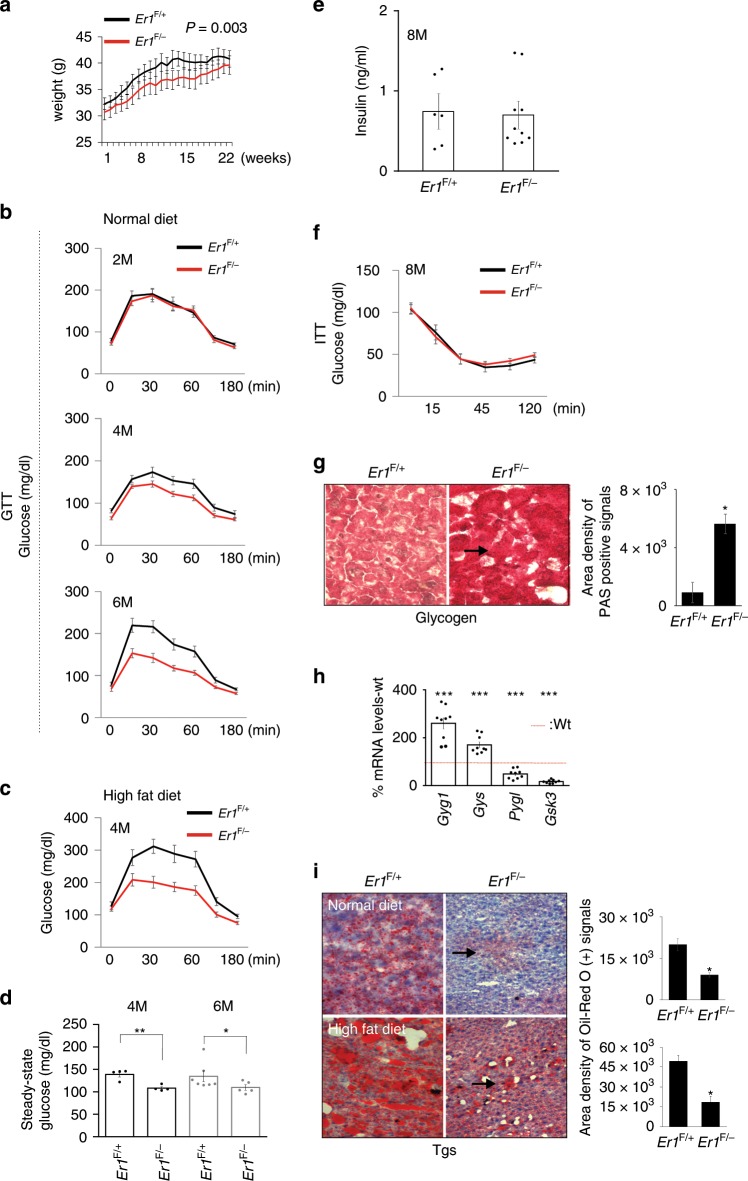
Fig. 3. The ERCC-XPF defect in macrophages triggers metabolic changes in Er1F/− mice.
a Weights curves of 2-months-old Er1F/− and Er1F/+ animals (n = 8) over a period of 22 weeks. b Glucose tolerance test (GTT) graphs of 2-months-old Er1F/− and Er1F/+ mice fed on a normal diet for a period of 2-, 4-, and 6-months (M), as indicated. c GTT graphs of 2-months-old Er1F/− and Er1F+ mice (n = 10) fed on a high-fat diet for a period of 4 months (M). d Steady-state glucose serum levels of 4- and 6-months (M) old Er1F/− and Er1F/+ mice after 2 h of fasting (n = 8). e Insulin serum levels of 8-months (M) old Er1F/− (n = 10) and Er1F/+ (n = 7) mice (f) Insulin tolerance test (ITT) graphs of 8-months (M) old Er1F/− and Er1F/+ mice (n = 8). g Representative periodic acid–Schiff (PAS) staining and quantification (3 optical fields per animal) of glycogen in Er1F/+ and Er1F/− livers (n = 4 animals per genotype). h Gyg1, Gys, Pygl, and Gsk3 mRNA levels in Er1F/+ (red dotted line) and Er1F/− livers. i Representative Red-oil staining and quantification (three optical fields per animal) of triglycerides in the liver of Er1F+ and Er1F/− mice (n = 3) fed on normal or high fat diet (as indicated); arrowhead indicates the decrease in fat deposition in the livers of Er1F/− animals fed on normal or high fat diet (as indicated). Error bars indicate S.E.M. among replicates (n ≥ 3). Asterisk indicates the significance set at p-value: *≤0.05, **≤0.01 (two-tailed Student’s t-test). Gray line is set at 5 μm scale.

