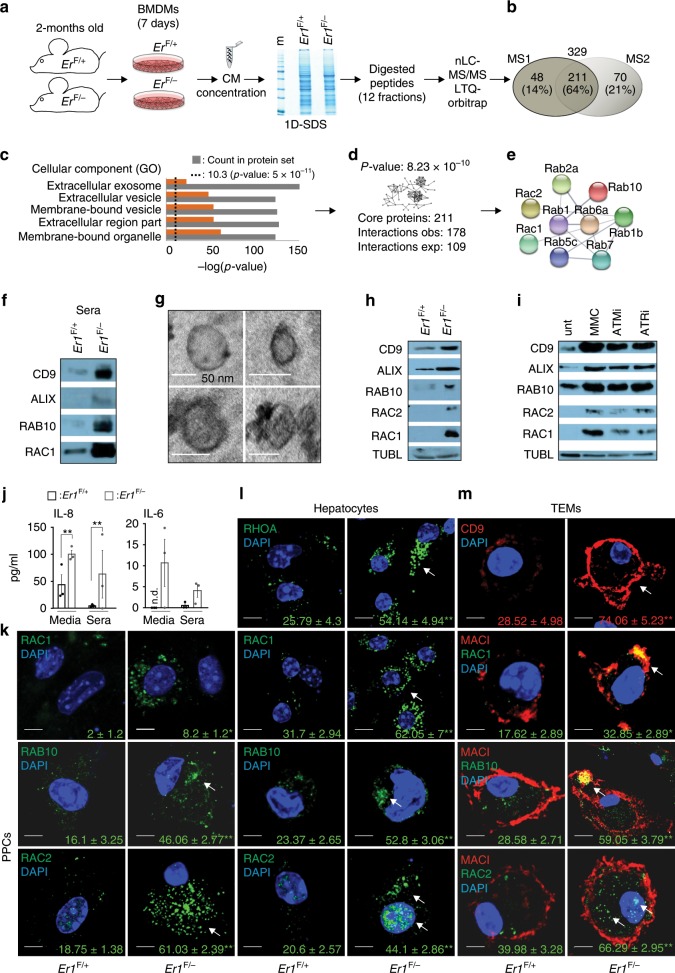
Fig. 5. DNA damage promotes the generation and secretion of extracellular vesicles (EVs) in Er1F/− macrophages.
a Schematic representation of the high-throughput MS analysis in Er1F/− compared to Er1F/+ BMDMs media. b Venn’s diagram of proteins identified in Er1F/− media from two independent biological replicates. c List of significantly over-represented GO terms associated with Cellular Component. d Number of observed (obs.) and expected (exp.) known protein interactions within the core 211 shared proteins set. e Schematic representation of the major protein complex identified in BMDM media. f Western blot analysis of CD9, ALIX, RAB10, and RAC1 proteins levels in the EV fraction of Er1F/− and Er1F/+ sera (n = 6; see also Supplementary Fig. 5A; left panel). g Transmission electron microscopy of EVs marking the presence of exosomes with a size 30–80 nm in Er1F/− TEM media. h Western blot analysis of CD9, ALIX, RAB10, RAC2, and RAC1 proteins levels in Er1F/− compared to Er1F/+ EV fraction of BMDM media (n = 5). A graph showing the fold change and statistical significance of the indicated protein levels is shown in Supplementary Fig. 5A; right panel. i Western blot analysis of CD9, ALIX, RAB10, RAC2, and RAC1 proteins levels in the EV fraction of media derived from the MMC-treated and control BMDMs exposed to ATM (ATMi) or ATR (ATRi) inhibitors (as indicated; n = 3). A graph showing the fold change and statistical significance of the indicated protein levels is shown in Supplementary Fig. 5C. j IL8 and IL6 protein levels in Er1F/− and Er1F/+ sera and BMDM media (as indicated). k Immunofluorescence detection of RAC1 (~500 cells per genotype), RAB10 (~150 cells per genotype) and RAC2 (~150 cells per genotype) in Er1F/− and Er1F/+ PPCs (n > 400 cells per genotype) (see also Supplementary Fig. 5e for RHOA), l hepatocytes (n > 100 cells per genotype) and m thioglycolate-elicited macrophages (TEMs) (n > 500 cells per genotype). Colored numbers indicate the average percentage of positively stained cells ± SEM for the indicated, color-matched protein. Error bars indicate S.E.M. among replicates (n ≥ 3). Asterisk indicates the significance set at p-value: *≤0.05, **≤0.01 (two-tailed Student’s t-test). (nd): not detected. Gray line is set at 5 μm scale.

