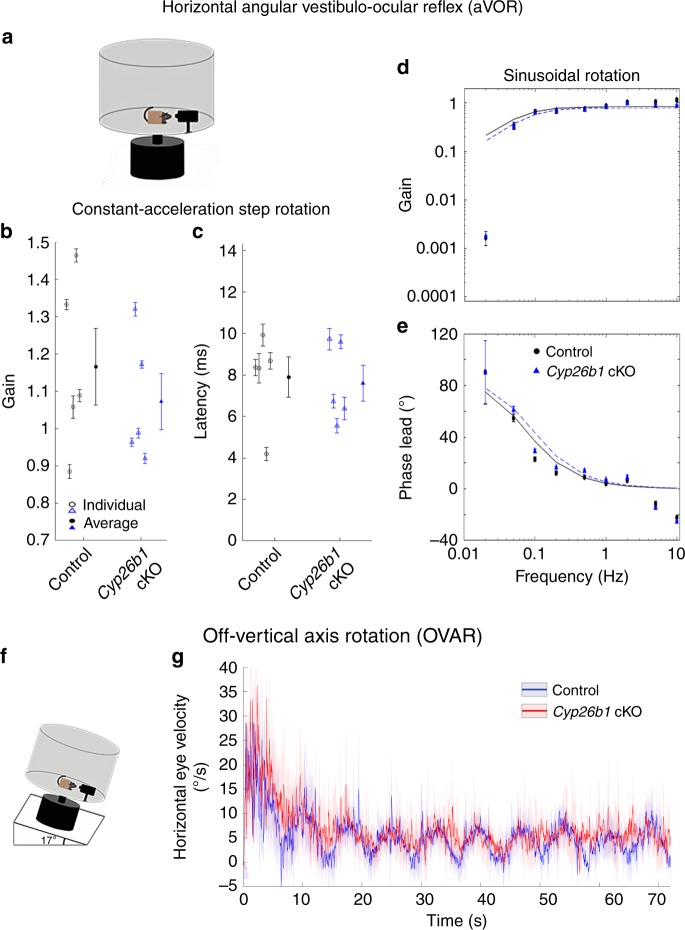
Fig. 7. Normal aVOR and OVAR responses in Cyp26b1 cKO mice.
a Schematic view of aVOR apparatus. Constant-acceleration step gain GA (b) and latency (c) for aVOR responses to whole-body, 3000°/s2 whole-body passive yaw rotations in darkness about an Earth-vertical axis through the head. Open markers denote individual mice; thick markers and lines show mean ± SEM. Gain (d) and phase lead (e) for yaw slow-phase aVOR responses to 0.02–10 Hz, 100°/s peak velocity sinusoidal, whole-body passive yaw rotations. Solid and dashed lines show first-order high-pass filter model fits to control and Cyp26b1 cKO mouse population data, respectively. The high variability of phase and 0.02 Hz and relatively poor fit to gain data at 0.02 Hz are due to the small amplitude of responses at that frequency. Differences between control and Cyp26b1 cKO mice were not significant for GA, latency, model gain, or model time constant (P < 0.05 for all comparisons, Mann–Whitney U test). f Schematic view of apparatus for off-vertical axis rotation (OVAR). Pitch of the table was maintained at 17°. g No significant difference in the eye velocity was observed between control and Cyp26b1 cKO mice during transient response (~20 s; amplitude: 43.8 ± 8.3 vs. 38.7 ± 7.4° (P = 0.66, unpaired t test), time constant: 4.1 ± 1.1 vs. 5.1 ± 2.3 s (P = 0.68, unpaired t test), when both semicircular canal and otolith organs are stimulated, and steady-state response (~20 s; amplitude: 5.3 ± 0.72 vs. 5.8 ± 0.75° (P = 0.64, unpaired t test), bias: 10.5 ± 1.3 vs. 8.5 ± 1.3 (P = 0.33, unpaired t test), time when only responses from otolith organs are expected to be measured.

