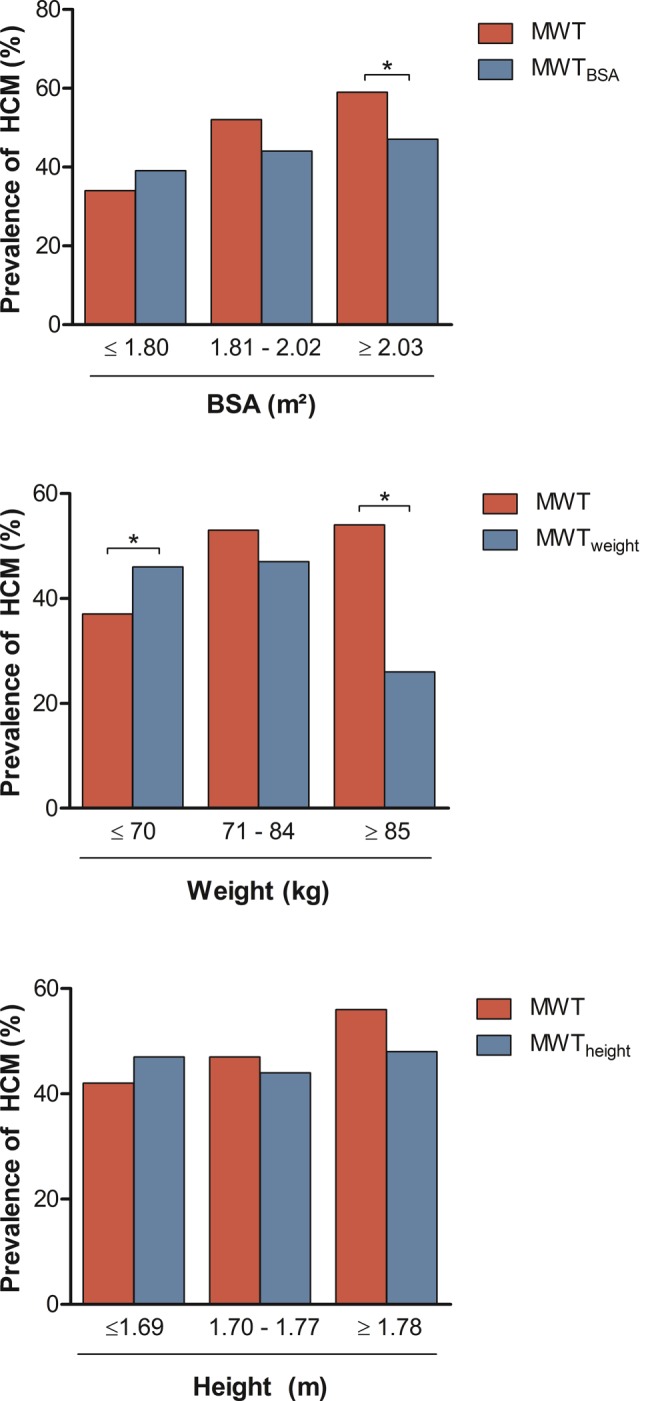
Fig. 2.

Prevalence of HCM diagnoses in study group, after indexation according to a BSA, b weight and c height. Significant differences in proportions of HCM were seen in the highest BSA tertile, after indexation for BSA, and in the lowest and highest weight tertiles after indexation for weight. Asterisk denotes significant differences between proportions. BSA body surface area, HCM hypertrophic cardiomyopathy, MWT maximal wall thickness
