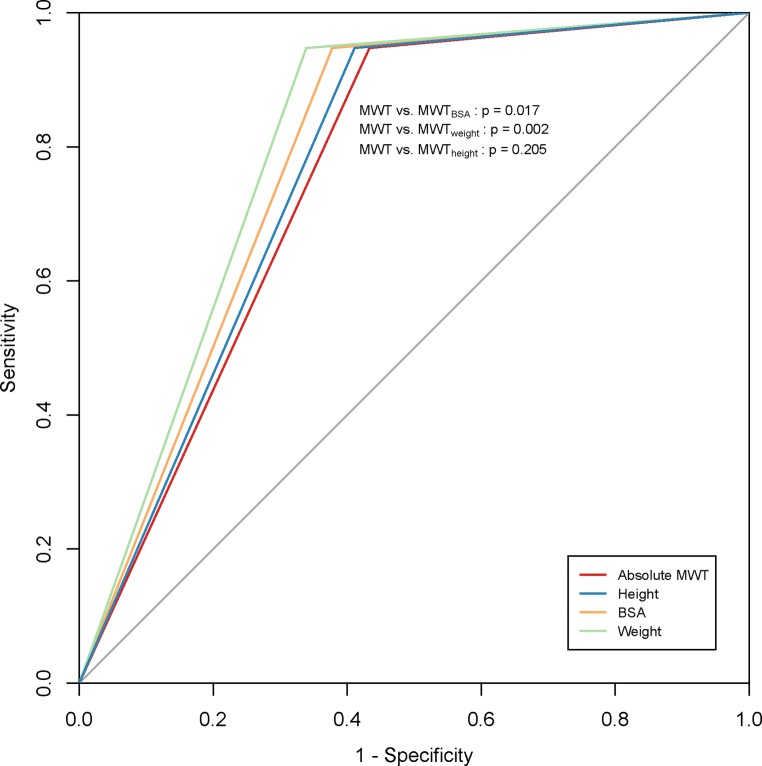
Fig. 3.
Receiver operating characteristic curves illustrating predictive accuracy of all diagnostic methods for HCM-related events. A significant increase in the AUC was seen using BSA- or weight-indexed values: difference between areas was 0.028 [95% CI 0.005–0.051] for MWT and MWTBSA, 0.047 [0.017–0.078] for MWT and MWTweight and 0.011 [−0.006–0.028] for MWT and MWTheight. HCM hypertrophic cardiomyopathy, AUC area under the curve, BSA body surface area, MWT maximal wall thickness

