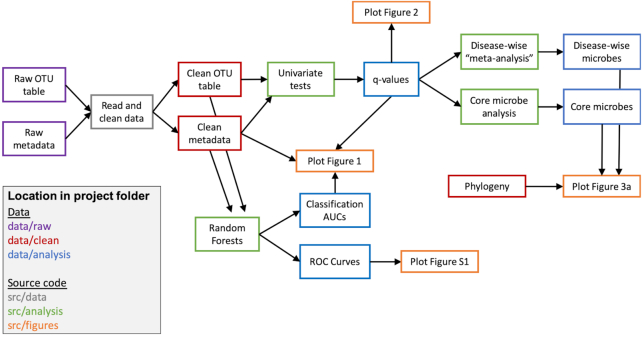
Figure 4:
Schematic of a subset of the steps involved in the workflow for my meta-analysis. Each box contains a description of the data or analysis at that step, and arrows indicate progression through the analysis workflow. Box color indicates respective location in the project structure. Dependencies between input data, intermediate files, and scripts are encoded in the Makefile, which automatically reruns any necessary steps when input data or files are updated. For example, if the script to perform univariate steps is updated, all steps that depend on that box get rerun and updated; i.e., Figs 1, 2, and 3a are all remade. In contrast, if the code to run the random forests is updated, only Figs 1 and S1 are updated. AUC: area under the ROC curve; ROC: receiver operating characteristic.

