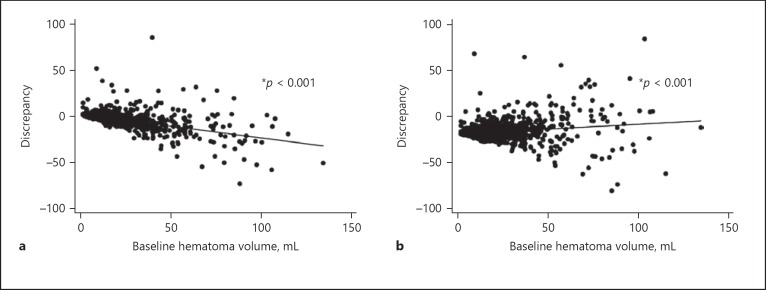
Fig. 1.
Association between baseline hematoma volume and measurement discrepancy. Linear regression model. a ABC/2 versus MIStar. Discrepancy = 0.28692 − 0.25488 × hematoma volume (r2 = 0.3131). A positive correlation for differences between the ABC/2 method and MIStar and increasing volume of ICH (measured using MIStar) is seen with larger discrepancies when ICH volume increases. b mABC/2 versus MIStar. Discrepancy = −0.18106 + 0.13183 × hematoma volume (r2 = 0.0399). A positive correlation for differences between the mABC/2 method and MIStar and increasing volume of ICH with larger discrepancies is seen when ICH volume increases.

