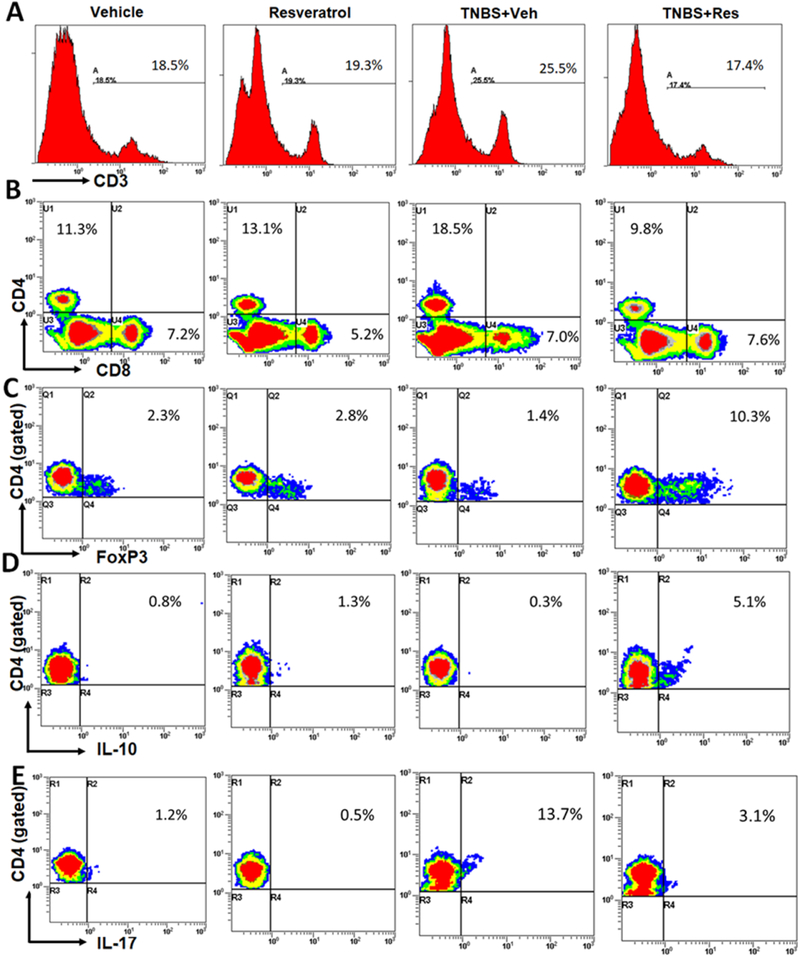
Figure 2: Treatment with resveratrol alters T cell subsets in the MLN of TNBS-induced mice.
TNBS disease and treatment with resveratrol were performed as described in Figure 1 legend. MLNs were excised from experimental groups (n=5 per experimental group), stained with T cell-specific antibodies, and analyzed by flow cytometry. Representative T cell subset staining by flow cytometry was as follows: (A) CD3+ positive histogram plot; (B) CD4+ and CD8+ dot plot; (C) CD4+-gated FoxP3+ dot plot; (D) CD4+-gated IL-10 dot plot; (E) CD4+-gated IL-17 dot plot.

