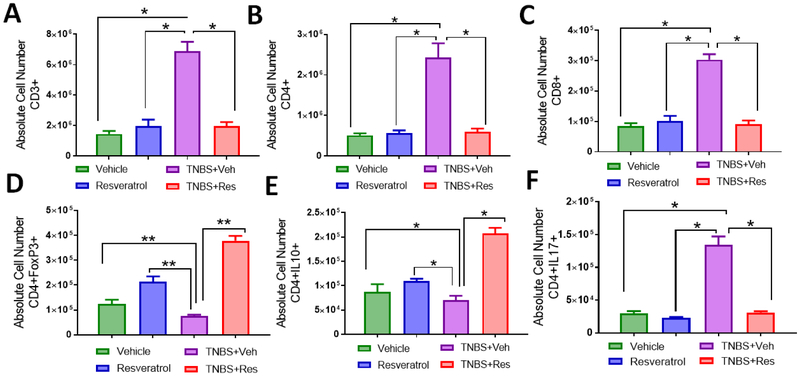
Figure 3: Treatment with resveratrol increases absolute cell numbers of anti-inflammatory T cell subsets in the MLN of TNBS-induced mice.
TNBS disease and treatment with resveratrol were performed as described in Figure 1 legend. MLNs were excised from experimental groups (n=5 per experimental group), stained with T cell-specific antibodies, and analyzed by flow cytometry (as represented in Figure 2). Bar graphs depict absolute cell numbers in MLN for all T cells (F), T helper cells (G), cytotoxic T cells ( H), Tregs (I), T helper producing IL-10 cells (J), and Th17 cells (K). Significance (p-value: *<0.05, **<0.01, ***<0.005, ****<0.001) was determined by using one-way ANOVA and post-hoc Tukey’s test for bar dot graphs. Data are representative of at least 3 independent experiments.

