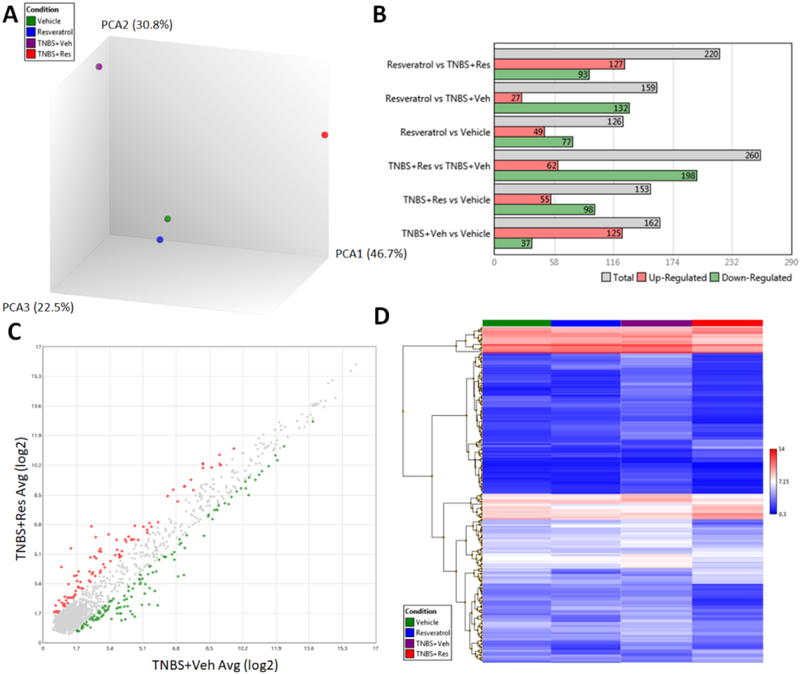
Figure 4: Treatment with resveratrol alters the miR profile in TNBS-induced colitis MLN.
TNBS disease and treatment with resveratrol were performed as described in Figure 1 legend. RNA from MLN of experimental groups was isolated for miR microarray analysis using the murine-specific Affymetrix miRNA 4.0 chip. Experimental groups (Vehicle, Resveratrol, TNBS+Veh, and TNBS+Res) consisted of pools of 5 mice per group. Affymetrix Expression Console Version software was used to generate the following comparisons: (A) 3D PCA plot comparing all experimental groups; (B) multiple bar graph comparisons depicting significantly altered upregulated and downregulated (± 2 fold change) miRs between two experimental groups; (C) scatter plot depicting 260 significantly upregulated (red dots) and downregulated (green dots) miRs out of 3195 total between TNBS+Res and TNBS+Veh; and (D) heat map depicting raw expression values of the 260 aforementioned miRs among the 4 different experimental groups.

