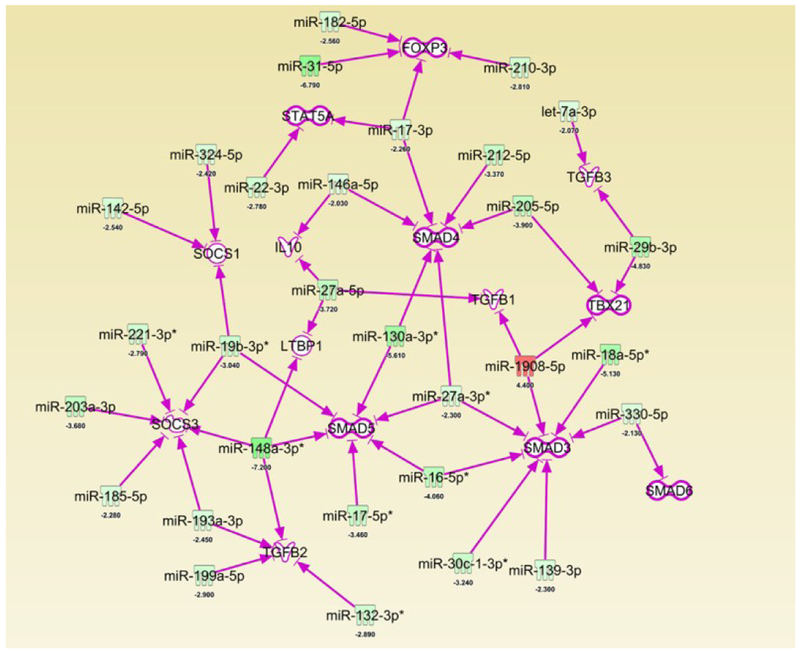
Figure 5: Treatment with resveratrol results in downregulation of several miRs that target anti-inflammatory T cell-associated factors.
TNBS disease and treatment with resveratrol were performed as described in Figure 1 legend. 260 significantly altered miRs between TNBS+Res vs. TNBS+Veh noted in Figure 3 legend were subjected to Ingenuity Pathway Analysis (IPA). Depicted is an IPA-generated interaction chart showing significantly altered miRs targeting factors associated with anti-inflammatory T cell responses. Green colors represent downregulated miRs and Red colors represent upregulated miRs. The calculated fold changes between TNBS+Res and TNBS+Veh groups are depicted below each included miR. Purple arrows indicate predicted, highly predicted, and experimentally-proven interactions of the miR with target mRNA shown.

