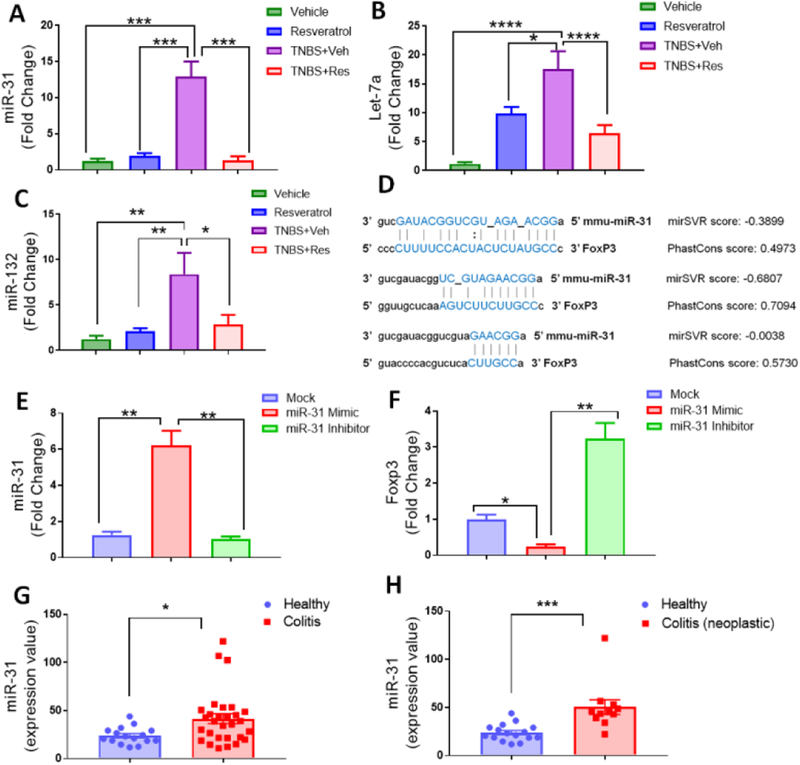
Figure 6: Resveratrol prevents FoxP3-targeting miR-31 upregulation in TNBS-induced colitis which correlates with miR-31 upregulation in human UC patients.
TNBS disease and treatment with resveratrol were performed as described in Figure 1 legend. RNA was isolated from MLN of Vehicle (n=5), Resveratrol (n=5), TNBS+Veh (n=5), and TNBS+Res (n=5) to validate expression levels of miR-31 (A), Let-7a (B), and miR-132 (C). (D) Predicted miR-31 and FoxP3 alignment sites (with mirSVR and Phastcon scores) were obtained from microrna.org. For transfection experiments, single-cell suspensions from normal mouse MLN were seeded (1×10⁵ cells per well) and activated with SEB (1μg/ml) for 24 hours before collecting total RNA from groups. Experimental groups consisted of transfection reagent only mock (n=5), miR-31 mimic (n=5), and miR-31 inhibitor (n=5). Depicted are PCR-generated expression fold changes for miR-31 (E) and FoxP3 (F). For human samples depicted, raw expression values of miR-31 from colonic biopsies were obtained from GEO data GSE68306. Two comparisons are depicted: (G) Normal Healthy controls (n=16) vs. all UC patients (n=29); and (H) Normal Healthy controls (n=16) vs. UC patients associated with neoplasia (n=11). Significance (p-value: *<0.05, **<0.01, ***<0.005, ****<0.001) was determined by using one-way ANOVA and post-hoc Tukey’s test for bar dot graphs when comparing three or more groups. Data are representative of at least 3 independent experiments. For human datasets, significance was determined using an unpaired, two-tailed t test.

