Figure 4.

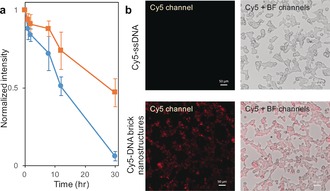
Testing stability in cellular media (10 % FBS) and conducting cellular uptake. a) Bare (blue circles) and nonuple (orange squares) DNA brick nanostructures were assembled, then incubated in 10 % FBS at 37 °C for varying lengths of time (0, 1, 2, 8, 12, 30 hours). Normalized band intensities, from three separately conducted gel electrophoresis experiments, were averaged and plotted against time. b) Nonuple DNA brick nanostructures (200 nm) were incubated with complementary Cy5‐ssDNA (2 μm) to fluorescently label the structures. HEK293T cells were incubated with 200 nm fluorescently labeled nonuple DNA brick nanostructures, and as control, a separate set of HEK293T cells were incubated with 2 μm Cy5‐ssDNA. Both sets were characterized via an inverted fluorescence microscopy using the Cy5 and bright‐field channels.
