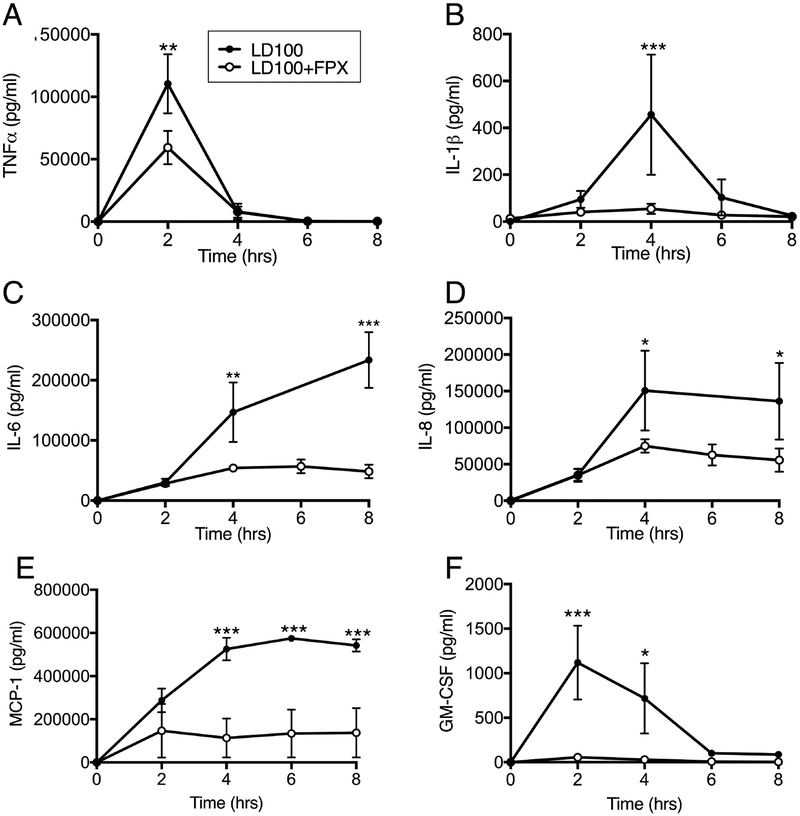
Fig. 4.
Effect of FPX treatment on the production of pro-inflammatory cytokines. (A) TNF, (B) IL1b, (C) IL-6, (D) IL-8, (E) MCP1 and (F) GM-CSF in plasma of baboons treated or not with FPX. Data are presented as mean± SEM. For all graphs, asterisks indicate a statistically significant difference between LD100 and LD100+FPX, as calculated with the linear mixed effects model (*P < 0.05, **P <0.01, ***P < 0.001).

