Fig. 1.
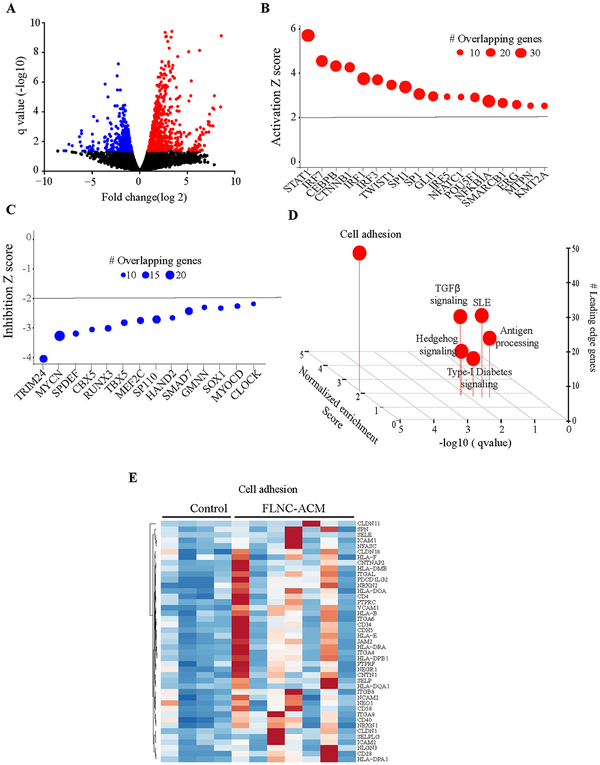
Dysregulated gene expression in ACM cardiac tissue samples carrying FLNC variants. A). Volcano plots showing differentially expressed genes (q < 0.05) in ACM samples compared to controls. Z score plots showing transcriptional regulators targeting B). upregulated or C). downregulated genes. D). Gene set enrichment analysis plot of differentially expressed genes showing enrichment of genes involved in cell adhesion. E). Heatmap of dysregulated genes in the cell adhesion pathway.

