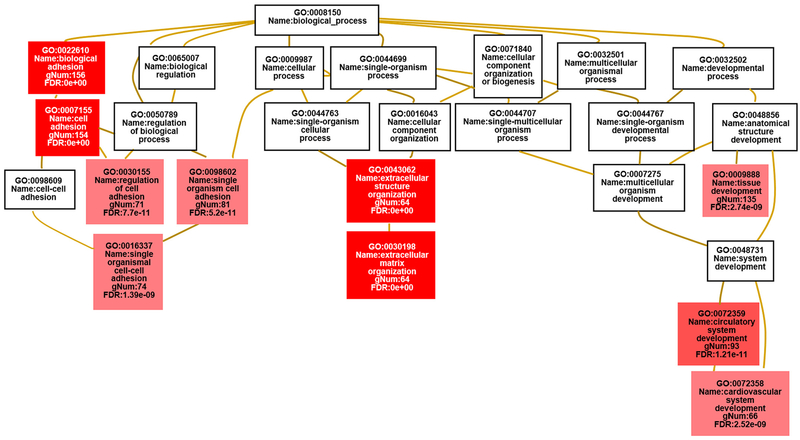
Fig. 2.
Map displaying the most enriched GO terms for the FLNC variant carriers vs control group using WebGestalt [25]. The enriched GO terms are shown in the context of the ontology tree; the stronger the red colour in the GO term boxes, the more significant the enrichment is. The GO terms in the white boxes are not significantly enriched but are included in order to provide information about the parentage of the enriched terms. gNum, Number of genes in the gene set also in the category. (For interpretation of the references to colour in this figure legend, the reader is referred to the web version of this article.)

