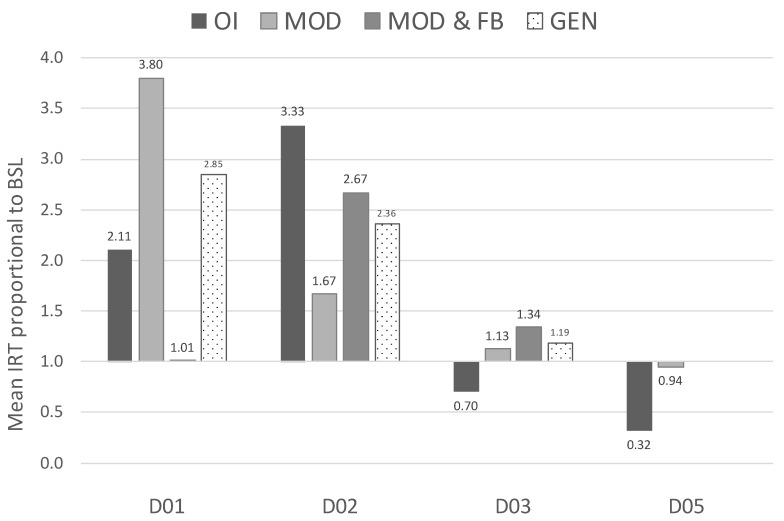
Figure 3.
Mean inter-response times (IRT) proportional to baseline measures (FAtang or FAattn) across owner-led BST phases and the generalisation phase, which was carried out by the first author. Values below 1 represent shorter mean IRTs between jumps, when compared to baseline measures (increase in rate of responses). Proportions were calculated by averaging the IRT of each phase and dividing it by the average IRT of baseline. For example, in the case of dog D03 during OI phase, mean IRT of 14 s was divided by mean baseline IRT of 20 s, which resulted in a proportional IRT of 0.70. This value indicates that the length of IRTs dropped 70% when compared to baseline levels.

