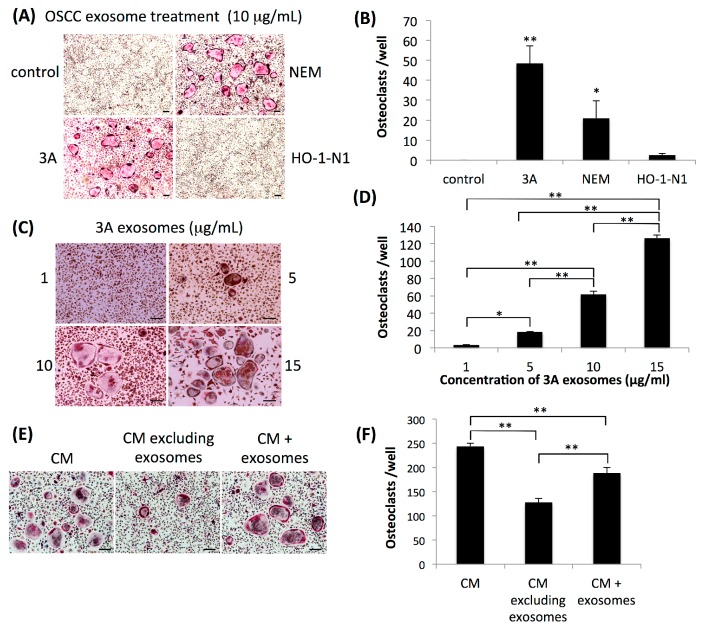
Figure 2.
Effects of exosomes derived from OSCC cell lines on osteoclastogenesis. (A) Representative views of TRAP staining four days after the application of exosomes derived from 3A, NEM, or HO-1-N1 cells to OPCs. Control represents OPCs without the application of exosomes. Bars represent 100 μm. (B) Quantitative data on the number of induced osteoclasts relative to that of the control. Values are the mean ± SEM of more than three wells. ** p < 0.001, * p < 0.05 (one-way ANOVA with the Tukey–Kramer method). (C) Representative views of TRAP staining four days after the application of each concentration of exosomes derived from 3A cells to OPCs. Bars represent 100 μm. (D) Quantitative data on the number of induced osteoclasts relative to that of the culture application of 1 μg/mL of exosomes. Values are the mean ± SEM of three wells. **P < 0.001, * p < 0.05 (one-way ANOVA with the Tukey–Kramer method). (E) Representative views of TRAP staining four days after the cultivation of OPCs with conditioned medium containing 40% of the culture supernatant of 3A cells (CM), ultracentrifuged culture supernatant of 3A cells (CM excluding exosomes), or ultracentrifuged culture supernatant of 3A cells mixed with isolated exosomes (CM + exosomes). Bars represent 100 μm. (F) Quantitative data on the number of induced osteoclasts relative to that of the culture of OPCs with CM. Values are the mean ± SEM of three wells. ** p < 0.001 (one-way ANOVA with the Tukey–Kramer method).

