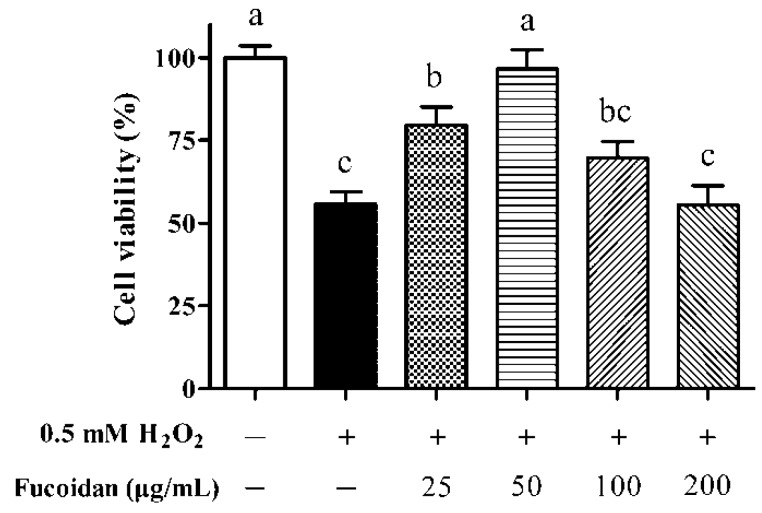
Figure 2.
Effect of different fucoidan concentrations on the cell viability of IPEC-1 cells under the conditions of oxidative stress. The data were calculated as a percentage of the control cells. Statistical differences between mean values were analyzed by ANOVA and Tukey’s post hoc test for multiple comparison. Values are means ± SE, n = 6. Different lowercase letters indicate statistically significant differences (p < 0.05).

