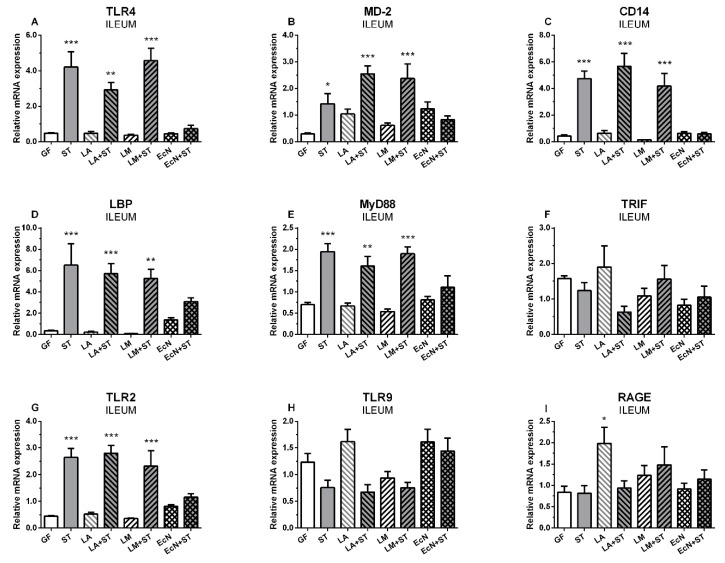
Figure 1.
mRNA relative expression (fold change) of TLR4 and its related molecules, TLR2, TLR9, and RAGE in the ileum. TLR4 (A), MD-2 (B), CD-14 (C), LBP (D), MyD88 (E), TRIF (F), TLR2 (G), TLR9 (H), and RAGE (I) are presented as mean + SEM. Differences between the control GF group and other groups were evaluated by one-way analysis of variance (ANOVA) with Dunnett’s multiple comparison post-hoc test and depicted * p ˂ 0.05, ** p ˂ 0.01, *** p ˂ 0.001; n = 6 for each group.

