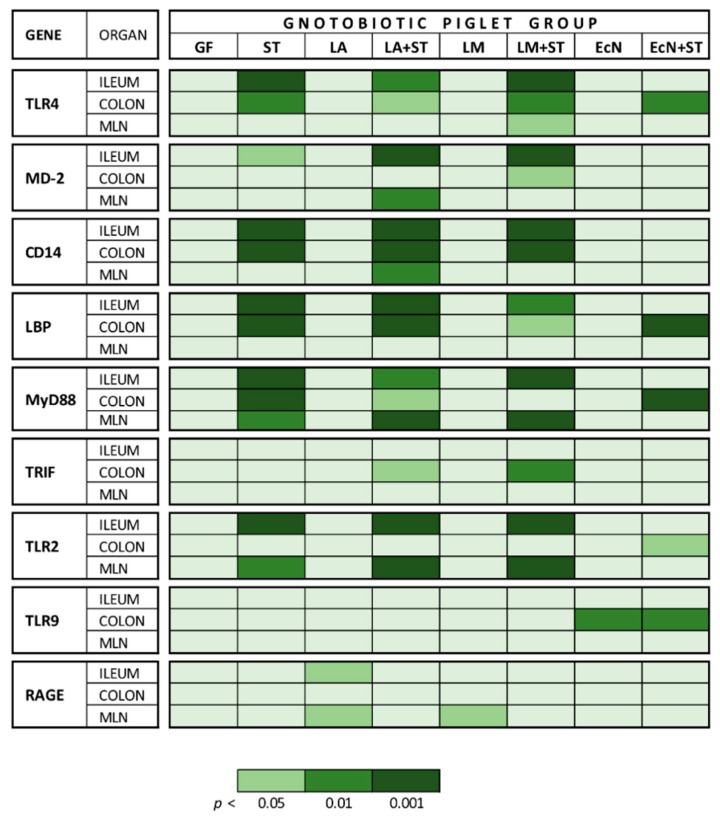
Figure 4.
Summarized mRNA relative expression of TLR4 and its related molecules, TLR2, TLR9, and RAGE in the ileum, colon, and MLN. Differences between the control GF group and other groups were evaluated by one-way analysis of variance (ANOVA) with Dunnett’s multiple comparison post-hoc test and depicted * p ˂ 0.05, ** p ˂ 0.01, *** p ˂ 0.001; n = 6 for each group.

