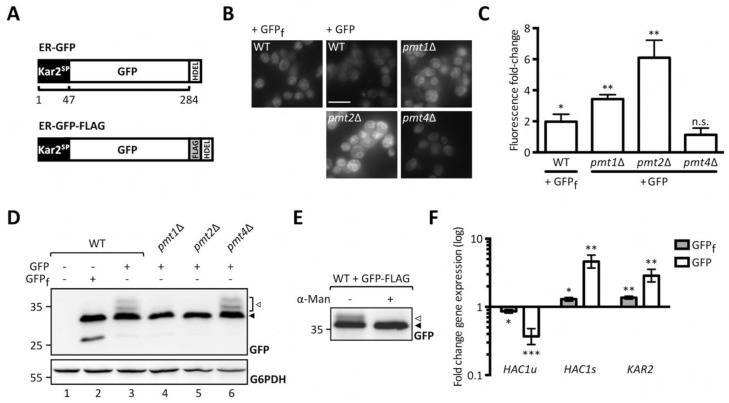
Figure 1.
Analysis of ER-GFP as a unfolded protein O-mannosylation (UPOM)-reporter. (A) Schematic representation of ER-GFP N-terminally fused to the endoplasmic reticulum (ER) targeting signal peptide from Kar2 and C-terminally fused to the HDEL ER retention sequence (upper panel) and scheme of FLAG-tagged ER-GFP used for immunoprecipitation in (C) (lower panel). Fluorescence analysis of wild type and pmtΔ strains with genomically integrated ER-GFP by microscopy (B) and flow cytometry (C). JEY06 (wild type ER-GFP), JCY010 (pmt1Δ ER-GFP), JCY011 (pmt2Δ ER-GFP), JCY012 (pmt4Δ ER-GFP), and JEY05 (wild type expressing ER-GFPf as negative control) cells were grown in yeast extract-peptone-dextrose (YPD) before being imaged under standard conditions (scale bar 10 μm) (B) or analyzed by flow cytometry (C). In (C) fluorescent signals resulting from analysis of 20,000 cells were normalized to wild type and results are plotted as fold-change. Error bars represent the range of values from three independent experiments. For statistical significance one-sample t-test was performed on log2(fold change). (D) Western blot analysis of ER-GFP O-mannosylation in total cell extracts from strains shown in (B) and (C). 20 μg of protein were resolved on a 12% PAA gel and detection was performed with an anti-GFP antibody. Wild type cells expressing ER-GFPf served as negative control and G6PDH was used as loading control. Arrows on the right indicate the main GFP signal (black arrow) and signals emanating from higher O-mannosylated GFP fractions (white arrow). (E) FLAG-tag immunoprecipitation of ER-GFP on total cell extracts from wild type cells expressing FLAG-tagged ER-GFP from the pN014 plasmid. Purified ER-GFP-FLAG-HDEL was subjected to α1-2,3,6 mannosidase treatment overnight at 37 °C and resolved on a 12% PAA gel. Detection was performed with an anti-GFP antibody. The signals emanating from higher O-mannosylated GFP-fractions (white arrow) collapse upon treatment into the main GFP signal (black arrow). Results are representative of two independent experiments. (F) RT-PCR analysis of HAC1u, HAC1s, and KAR2 mRNA levels in wild type cells expressing ER-GFPf and ER-GFP respectively. JEY05 (wild type ER-GFPf) and JEY06 (wild type ER-GFP) cells were grown in YPD, total RNA was extracted, and cDNA was prepared and used as a template for RT-PCR. Fold-change was calculated from three independent experiments with respect to ACT1 mRNA and error bars represent the confidence interval. For statistical significance one-sample t-test was performed on log2−ΔΔCt. N.s. = not significant. Asterisks report on statistical significance: * p ≤ 0.05, ** p ≤ 0.01, *** p ≤ 0.001.

