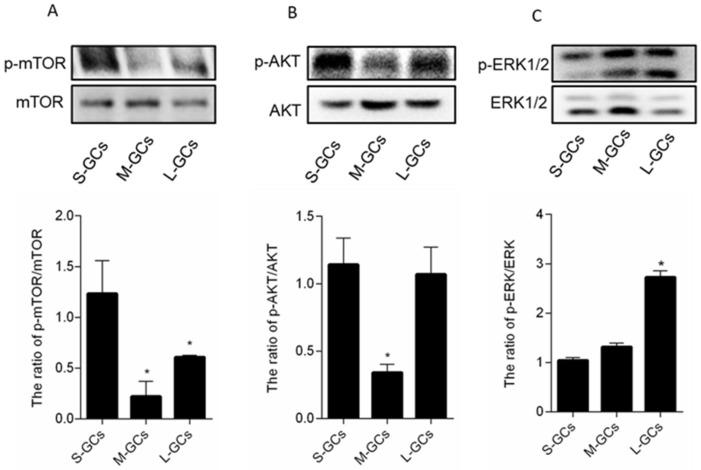
Figure 7.
Protein expression of the autophagy and apoptosis signaling pathways activated in GCs during follicular development. (A) mTOR and p-mTOR; (B) AKT and p-AKT; (C) ERK1/2 and p-ERK1/2. Data are means ± SEM of three independent replicates. * p < 0.05. S-GCs, GCs isolated from small follicles; M-GCs, GCs isolated from medium follicles; L-GCs, GCs isolated from large follicles.

