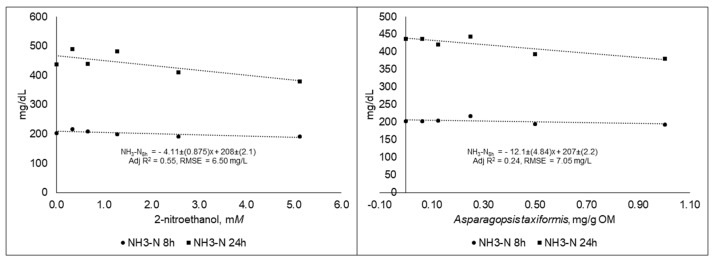
Figure 5.
Ammonia concentration (NH3-N) in fluid samples taken at different time points during 48 h in vitro incubation of a control diet (545:363:92 g/kg of grass silage:barley:rapeseed meal) treated with different levels (three replicates per level) of (A) 2-nitroethanol and (B) Asparagopsis taxiformis in experiment 2.

