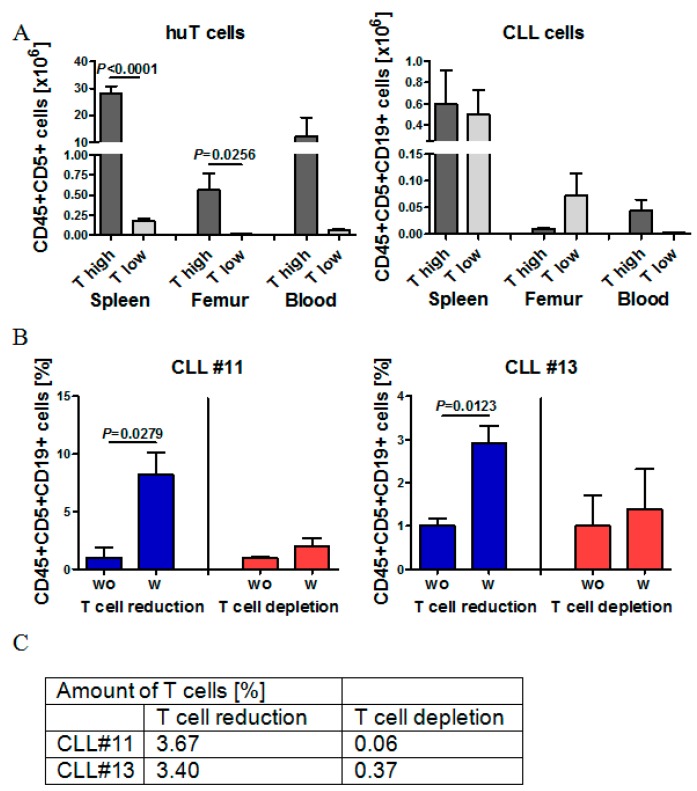
Figure 5.
The role of autologous T cells on CLL cell engraftment in NOG mice. (A) Mean numbers of human T cells and CLL cells in the spleen, femur and PB of NOG mice of transplantation T high (CLL patient #2, n = 4) and T low (CLL patient #4, n = 3). (B) Direct comparison of relative CLL cell engraftment in NOG mice receiving either CLL-PBMCs (n = 3, wo) or CLL-PBMCs with reduced or depleted autologous T cell fractions (n = 3, w). Left graph shows CLL#11 and right graph CLL#13. (C) Table depicts the amount of human T cells in CLL-PBMCs of CLL#11 and CLL#13 after T cell reduction or T cell depletion before injection into NOG mice.

