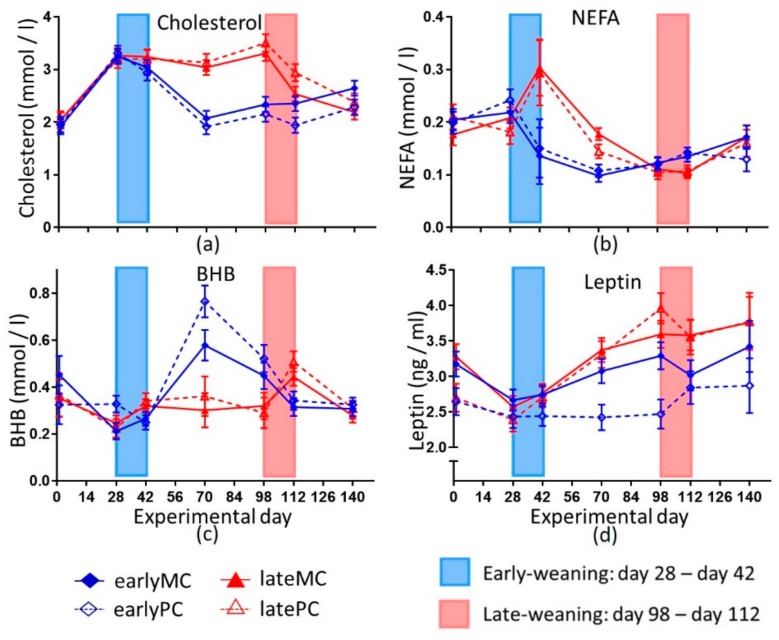
Figure 4.
Indicators for lipid metabolism of calves. Shown are cholesterol (a), non-esterified fatty acids (NEFA) (b), beta-hydroxybutyrate (BHB) (c) and leptin (d). Early-weaned calves were weaned gradually between days 28 and 42 of this trial. Late-weaned calves were weaned gradually between days 98 and 112 of this same trial. Data shown as LSmeans ± SEM, early-weaned calves from multiparous cows (earlyMC) n = 16, late-weaned calves from multiparous cows (lateMC) n = 16, early-weaned calves from primiparous cows (earlyPC) n = 15, late-weaned calves from primiparous cows (latePC) n = 12.
| p-Values | |||||||
|---|---|---|---|---|---|---|---|
| Parameters | Time (T) | Parity (P) | Weaning Age (W) | T × P | T × W | P × W | T × P × W |
| cholesterol | <0.001 | 0.995 | <0.001 | 0.990 | <0.001 | 0.327 | 0.344 |
| NEFA | <0.001 | 0.766 | 0.072 | 0.737 | <0.001 | 0.735 | 0.440 |
| BHB | <0.001 | 0.225 | 0.026 | 0.540 | <0.001 | 0.685 | 0.511 |
| leptin | <0.001 | 0.025 | <0.001 | 0.448 | <0.05 | 0.100 | 0.115 |

