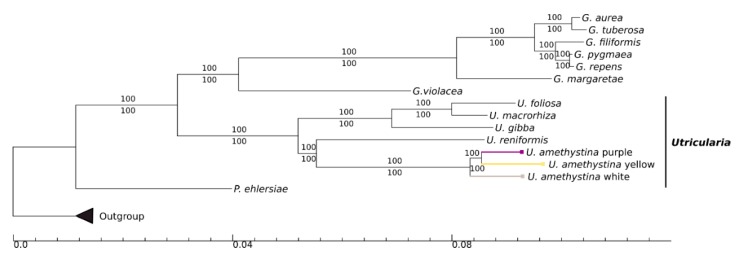
Figure 9.
Bayesian inference tree for available Lentibulariaceae chloroplast genomes and studied Utricularia amethystina. The values above branches denote the posterior probabilities and below maximum likelihood bootstrap. The branch colors correspond to each U. amethystina morphotype flower color. (G. = Genlisea; P. = Pinguicula; U. = Utricularia). The scale represents the expected changes per site.

