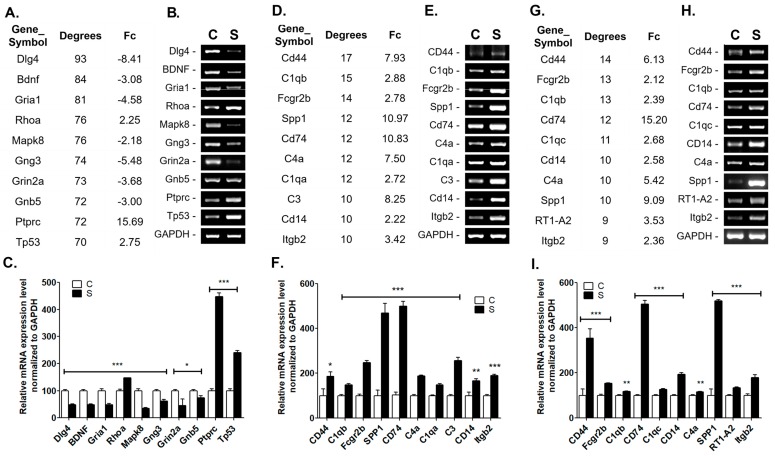
Figure 5.
Top 10 genes with higher degrees of PPI network analysis using StringTie. Validation was achieved using reverse-transcription polymerase chain reaction (RT-PCR). The top 10 genes with higher degrees of PPI network analysis and fold change (Fc) of RNA-sequencing analysis, validation of mRNA expression level using RT-PCR, and comparison of relative mRNA expression level from the penumbra between control at 1 week (A–C), 4 weeks (D–F) and 8 weeks (G–I) post-stroke, respectively. n = 6 per group, * p < 0.05, ** p < 0.01, *** p < 0.001 compared to control (C); Stroke (S).

