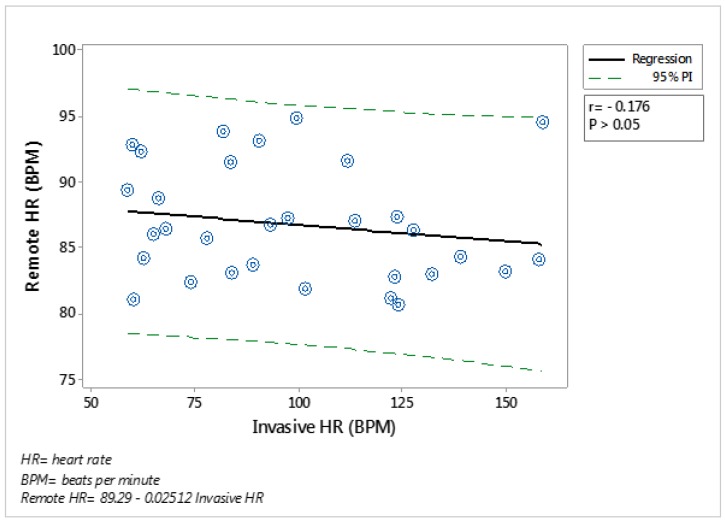
Figure 9.
Regression analysis of the relationship between heart rate (HR) obtained from Polar HR monitors and from videos recorded with a Raspberry-pi camera located in front of the animal, within a distance of 1.5 m, while the animal was in the crush, and analysing the ‘eye area’. The solid line shows the line of best fit, the dotted lines show the 95% and the equation and associated r and p-value are shown. Each point represents an average for the group within the each crush handling period. N = 32.

