Figure 1.
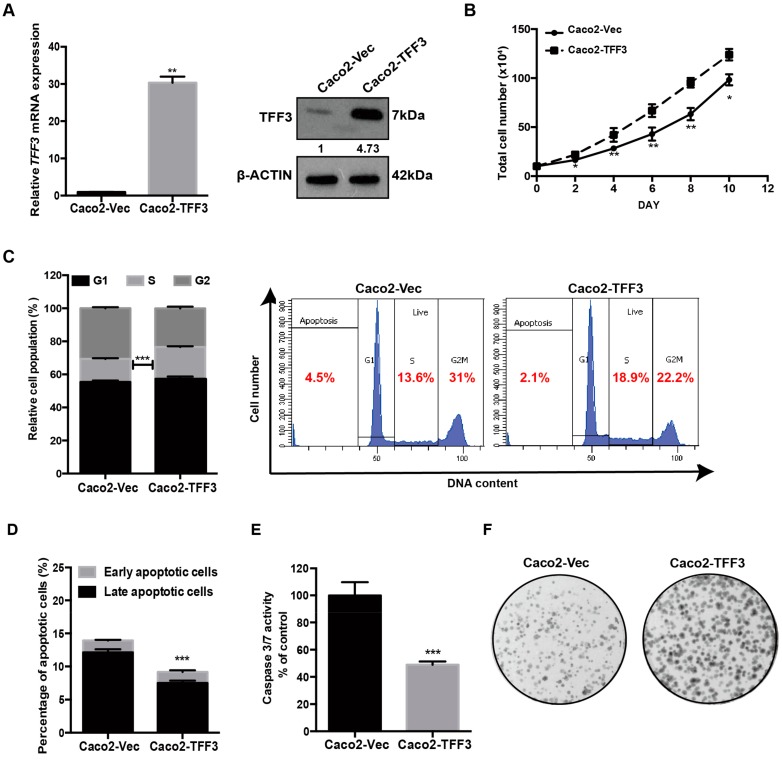
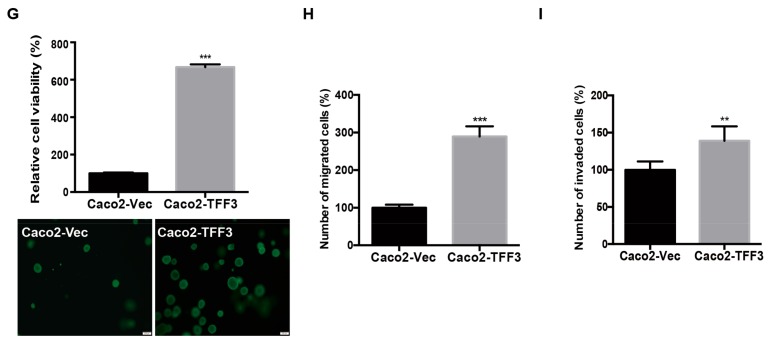
Forced expression of trefoil factor 3 (TFF3) promotes oncogenic behaviour of Caco2 cells. (A) Detection of TFF3 expression with qPCR and western blot. β-ACTIN was used as input control. (B) Total cell count. On day 0, 10 × 104 cells/well were seeded in six-well plates in triplicate. Cell numbers were counted at the indicated time points. (C) Cell cycle progression of cells cultured in 2% FBS medium was determined using propidium iodide (PI) staining followed by FACS analysis. The percentages of cells in each cell cycle phase are plotted. (D) Annexin-V/PI apoptotic cell death was determined after 24 h serum deprivation. The percentages of early apoptotic (Annexin-V-positive/PI-negative) and late apoptotic (Annexin-V-positive/PI-positive) cells are plotted. (E) Caspase 3/7 activities in the cells were determined after 24 h serum deprivation. (F) Foci formation. Cells were seeded in six-well plates and cultured for 10 days prior to fixation and crystal violet staining. (G) Three-dimensional Matrigel growth. Cells were cultured in 5% FBS medium containing 4% Matrigel. Cell viability was determined by AlamarBlue assay after nine days. Fold change of cell viability relative to –Vec cells is shown in the histogram. Representative microscopic images of viable colonies formed by the respective cells in 3D matrigel and stained by CellTrace calcein green acetoxymethyl (AM) are shown. Scale bar: 200 μm. (H) Cell migration assay. The cells that migrated across the transwell membrane after 12 h were stained with Hoechst 33342 and counted under the fluorescence microscope. Fold change of migrated cells relative to –Vec cells is shown in the histogram. (I) Cell invasion assay. Cells that invaded across the 10% Matrigel-coated transwell membrane after 24h were stained with Hoechst 33342 and counted under the fluorescence microscope. Fold change of invaded cells relative to –Vec cells is shown in the histogram. Data are expressed as mean ±SD. **, p < 0.01; ***, p < 0.001.


