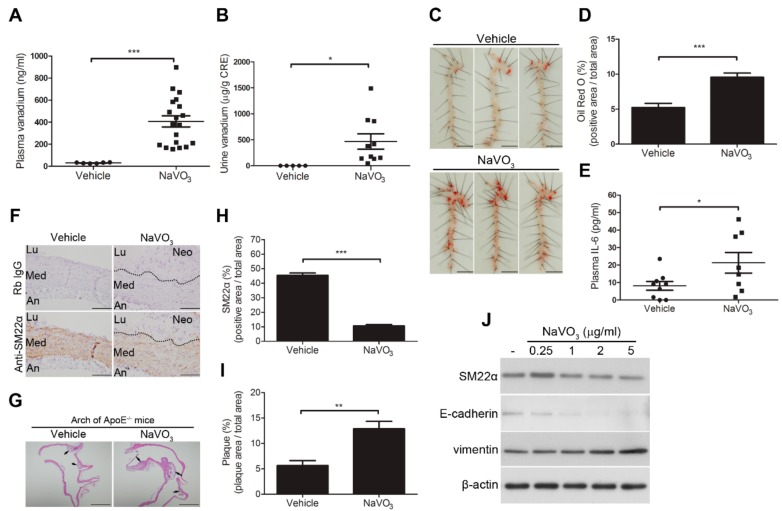
Figure 1.
Intranasal administration of NaVO3 induces atherosclerosis in apolipoprotein E-deficient knockout mice (ApoE−/−) mice. ApoE−/− mice were intranasally administered NaVO3 (4 mg/kg) once a week for 12 weeks. (A) Plasma vanadium levels in vehicle (endotoxin-free water)-treated mice (n = 6) and NaVO3-treated mice (n = 19) and (B) urine vanadium levels in mice treated with vehicle (n = 5) and NaVO3 (n = 10) were measured by ICP (Inductively coupled plasma)–mass spectrometry. The levels of vanadium in urine were normalized by creatinine (CRE). Each dot denotes an individual mouse. The solid black line denotes the mean value. (C) Lipid contents in aorta from mice treated with vehicle and NaVO3 were analyzed by Oil Red O staining. Scale bars represent 5 mm. (D) The area of positive staining for Oil Red O was quantified using ImageJ software as a percentage of total aortic area (n = 9 vehicle; n = 8 NaVO3). (E) Plasma interleukin 6 (IL-6) levels in vehicle treatment (n = 9) and NaVO3 treatment (n = 8) were measured by ELISA. (F) SM22α content in aorta tissues from mice was analyzed by immunohistochemistry. Immunopositive areas shown are shown at 400× magnification. An: adventitia; Lu: lumen; Neo: neointima; Med: media. Negative control represents staining with an irrelevant isotype control antibody. Scale bars represent 100 µm. (G) Paraffin-embedded tissues with atherosclerotic plaque (black arrow) were observed by hematoxylin and eosin (H&E) stain at 40× magnification. Scale bars represent 1 mm. (H) Immunopositive areas and atherosclerotic plaque in paraffin-embedded aorta tissues of mice treated with vehicle (n = 5) or NaVO3 (n = 10) were quantified using ImageJ software as a percentage of total aortic area in each section. Data in (A,B), (D,E), and (H,I) represent mean ± SEM. (J) Vascular smooth muscle cells (VSMCs) were treated with a different amount of NaVO3 for 48 h. Cell lysates were immunoblotted with antibodies for SM22α, E-cadherin, vimentin, or β-actin. Experiments were repeated three times with similar results. Data represent mean ± SEM of three experiments. * p < 0.05; ** p < 0.01; *** p < 0.001.

