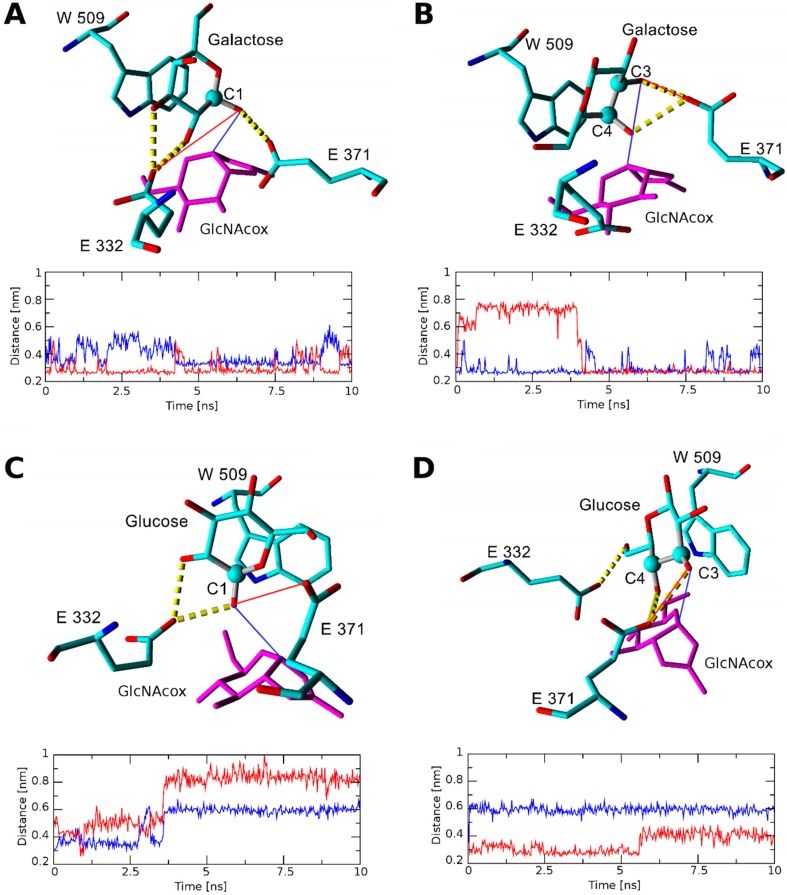
Figure 5.
Interaction of glucose and galactose docked in the WT-GlcNAcox complex after 10 ns of molecular dynamics. Hydrogen bonds (HB) are shown by yellow dashed lines. Acceptor atoms docked close to Glu371 at the beginning of the molecular dynamics simulation are represented by a ball. (A) Snapshot of the WT-GlcNAcox complex with galactose docked with C-1 close to Glu371, and the distance between O-1 of Gal and the OE2 atom of Glu371 in (red) or C-1 of GlcNAcox (blue). The respective distances are indicated in the models in respective colors. (B) Snapshot of the WT-GlcNAcox complex with galactose docked with C-3 close to Glu371 and the distance between O-3 of Gal and the OE2 atom of Glu371 (red) or C-1 of GlcNAcox (blue). The respective distances are indicated in the models in respective colors. (C) Snapshot of the WT-GlcNAcox complex with glucose docked with C-1 close to Glu 371, and the distance between C-1 of GlcNAcox (blue) or the OE2 atom of Glu371 (red) and O-1 of glucose. The respective distances are indicated in the models in respective colors. (D) Snapshot of the WT-GlcNAcox complex with glucose docked with C-3 close to Glu371, and the distance between C-1 of GlcNAcox (blue) or the OE1 atom of Glu371 (red), and O-3 of glucose. The respective distances are indicated in the models in respective colors.

