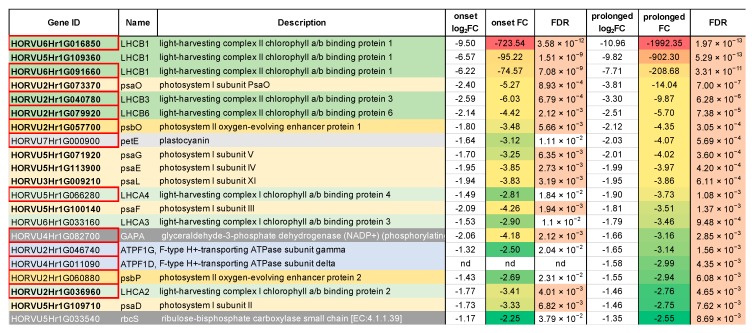
Figure 3.
The detailed annotation and expression of fold-changes of DEGs mapped onto the photosynthesis pathway. Red frames in ‘Gene ID’ column designate DEGs already identified at the onset of the drought stress. Green shading indicates genes encoding light-harvesting complex components, yellow indicates subunits of PSI, orange indicates subunits of PSII, gray indicates components of the electron transfer chain, dark gray indicates components of the Calvin cycle. FDR—False Discovery Rate.

