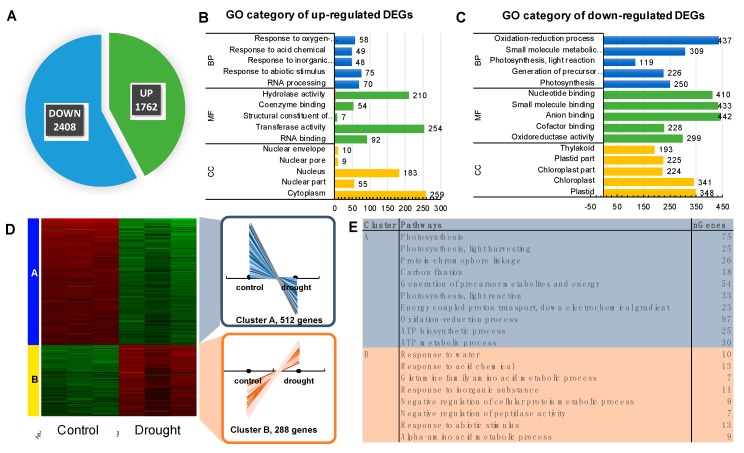
Figure 4.
Detailed analysis of the transcriptome response to drought using deep sequencing of the transcriptome (RNA-seq). (A) The number of differently regulated genes in response to drought when compared with controls (p ≤ 0.01; FC ≥ 2). (B) Significantly enriched gene ontology (GO) terms of up-regulated genes (p ≤ 0.05); BP–biological process, CC–cellular component, MF–molecular function. (C) Significantly enriched gene ontology (GO) terms of down-regulated genes (p ≤ 0.05); BP–biological process, CC–cellular component, MF—molecular function. (D) The heatmap of the K-means analysis performed using the 1000-top ranked DEGs. (E) Significantly enriched GO terms of Biological Processes in each of the two clusters identified. The number of genes downregulated shown in panel A versus panel C and the number of genes up-regulated presented in panel A versus B differs since only the five most significant GO terms are depicted for each GO category at panels B and C, thus not all genes are represented.

