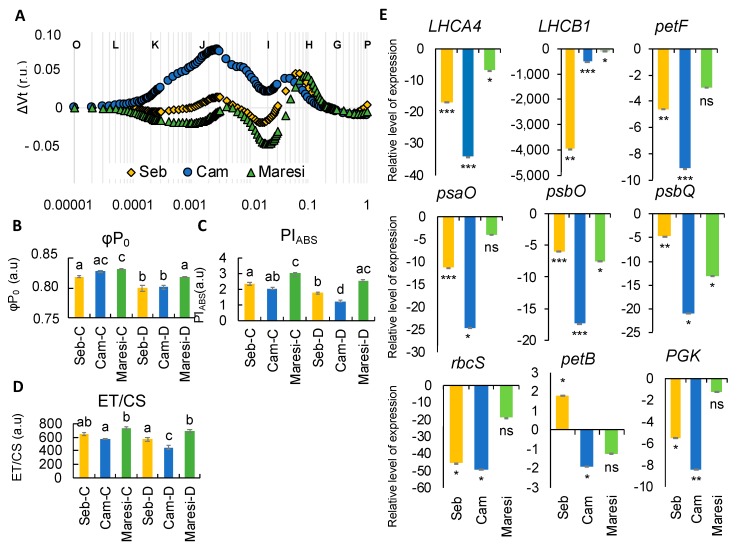
Figure 9.
The analysis of barley seedlings response to rapid dehydration. (A) The effects of rapid dehydration on the relative variable fluorescence (ΔVt) of the genotypes studied. Values are means (n = 15). r.u.—Relative units. (B) Maximum quantum yield of primary photochemistry (ϕP0). (C) Performance Index (PIABS). (D) Electron transport per illuminated cross-section (ET/CS). (E) Analysis of the expression of selected genes encoding components of the photosynthetic machinery. r.u.—Relative units. Different lower-case letters indicate the statistical differences between conditions according to the two-way ANOVA followed by the Tukey HSD test (p < 0.05). In case of genes expression, asterisks indicate the statistically significant changes of expression after dehydration when compared with controls in the case of each genotype (* p ≤ 0.05, ** p ≤ 0.01, *** p ≤ 0.001). a.u.—arbitrary units.

